Project Results
Welcome to the results section of our research on Digital Signal Processing in MIMO and Dispersive Systems. This page aims to provide an objective presentation of the data, findings, and progress made throughout the course of our collaboration between Infineon Technologies Austria AG and UAS Technikum Wien. It will serve as a comprehensive record of the outcomes and discoveries made as we explore the applications and implications of MEMS (Micro-Electro-Mechanical Systems) technology.
The content here is a reflection of our methodical approach to research and development, detailing the technical achievements, challenges overcome, and quantitative results obtained. As the project evolves, this page will be updated with detailed analyses, data charts, and interpretative discussions of our findings.
We recognize the importance of accuracy and detail in scientific communication and are committed to providing precise and reliable reports of our work. This information is intended for fellow researchers, industry partners, and anyone interested in the specifics of our project.
As our research progresses, results and new information will be added to this page. We invite you to revisit periodically to view the latest updates and insights. Thank you for your interest in our work.
Complete Hardware Setup and Overview (by Mr. Anderle 2024)
The hardware setup includes the base station with the LiteKitV2, the sensor head, and Ethernet cables for EMI reduction. All parts are 3D printed in black PLA from Polyterra using default settings.
Sensor Head Overview
The sensor components consist of the AFE_V2 and the UEB_V2. The figure below shows the equally spaced acoustic ports of the six microphones.
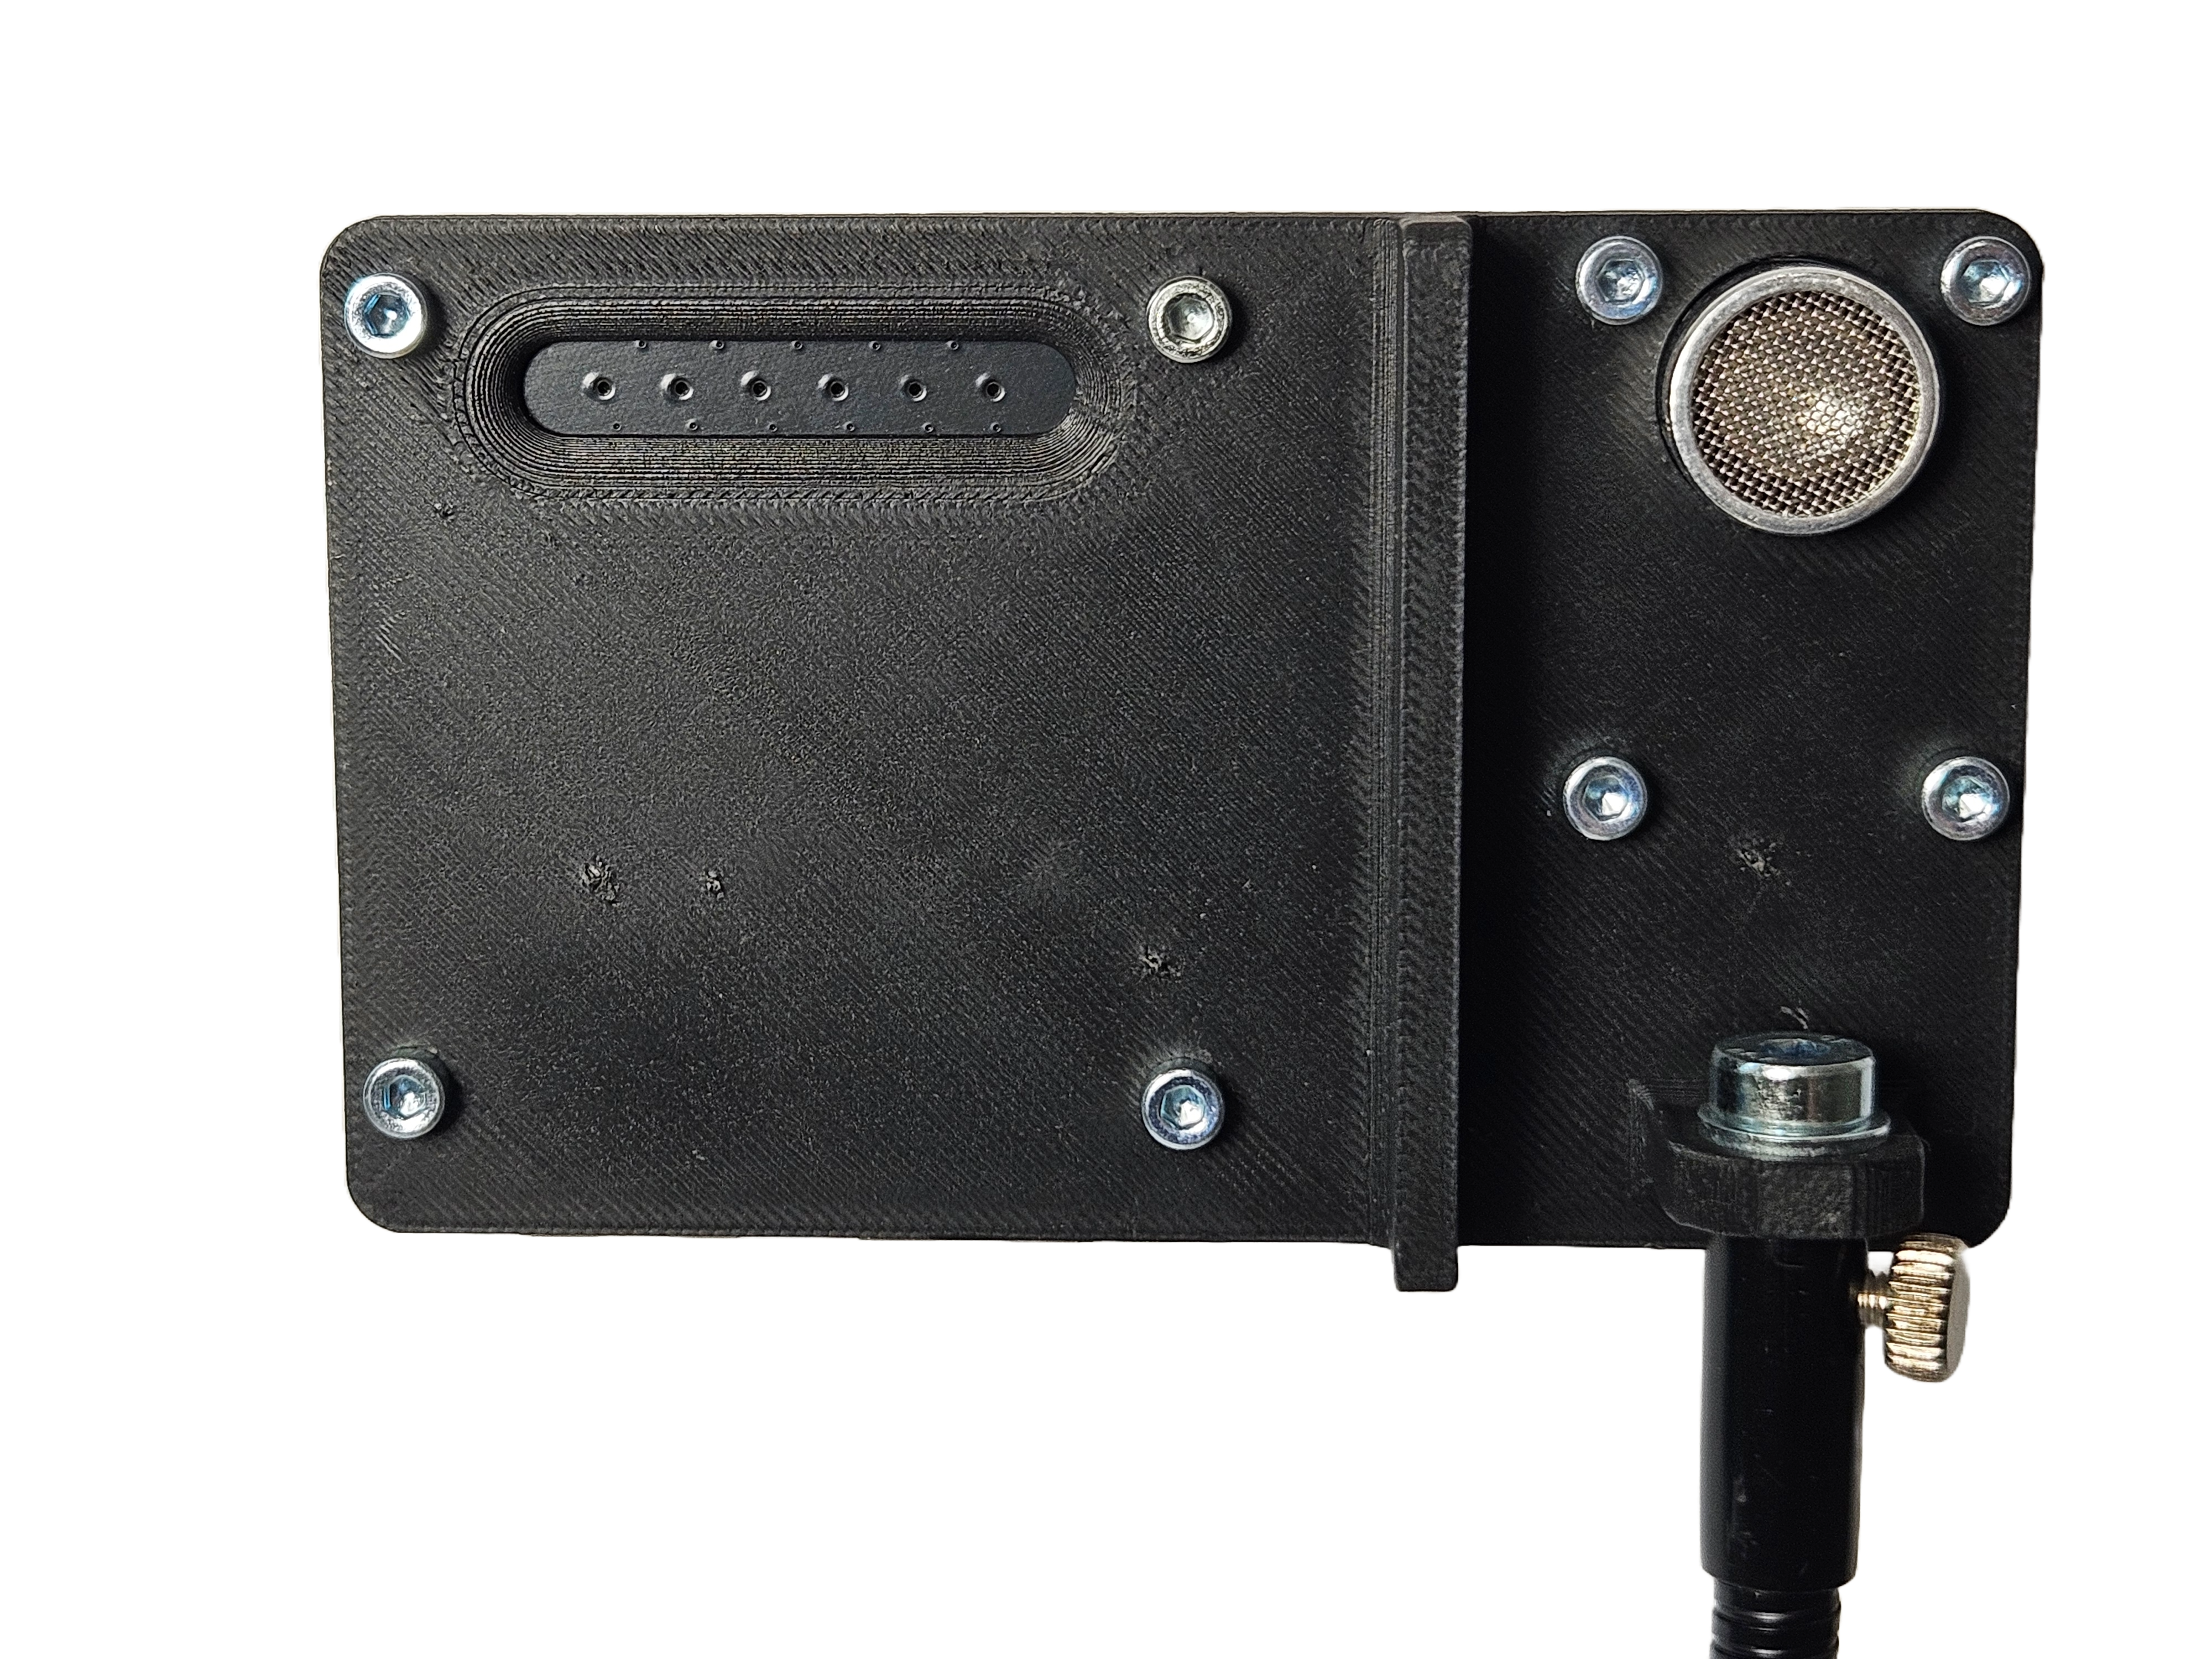
With this mounting configuration, as shown in the figure below, targeting the neck vein is much easier than with the older configuration.
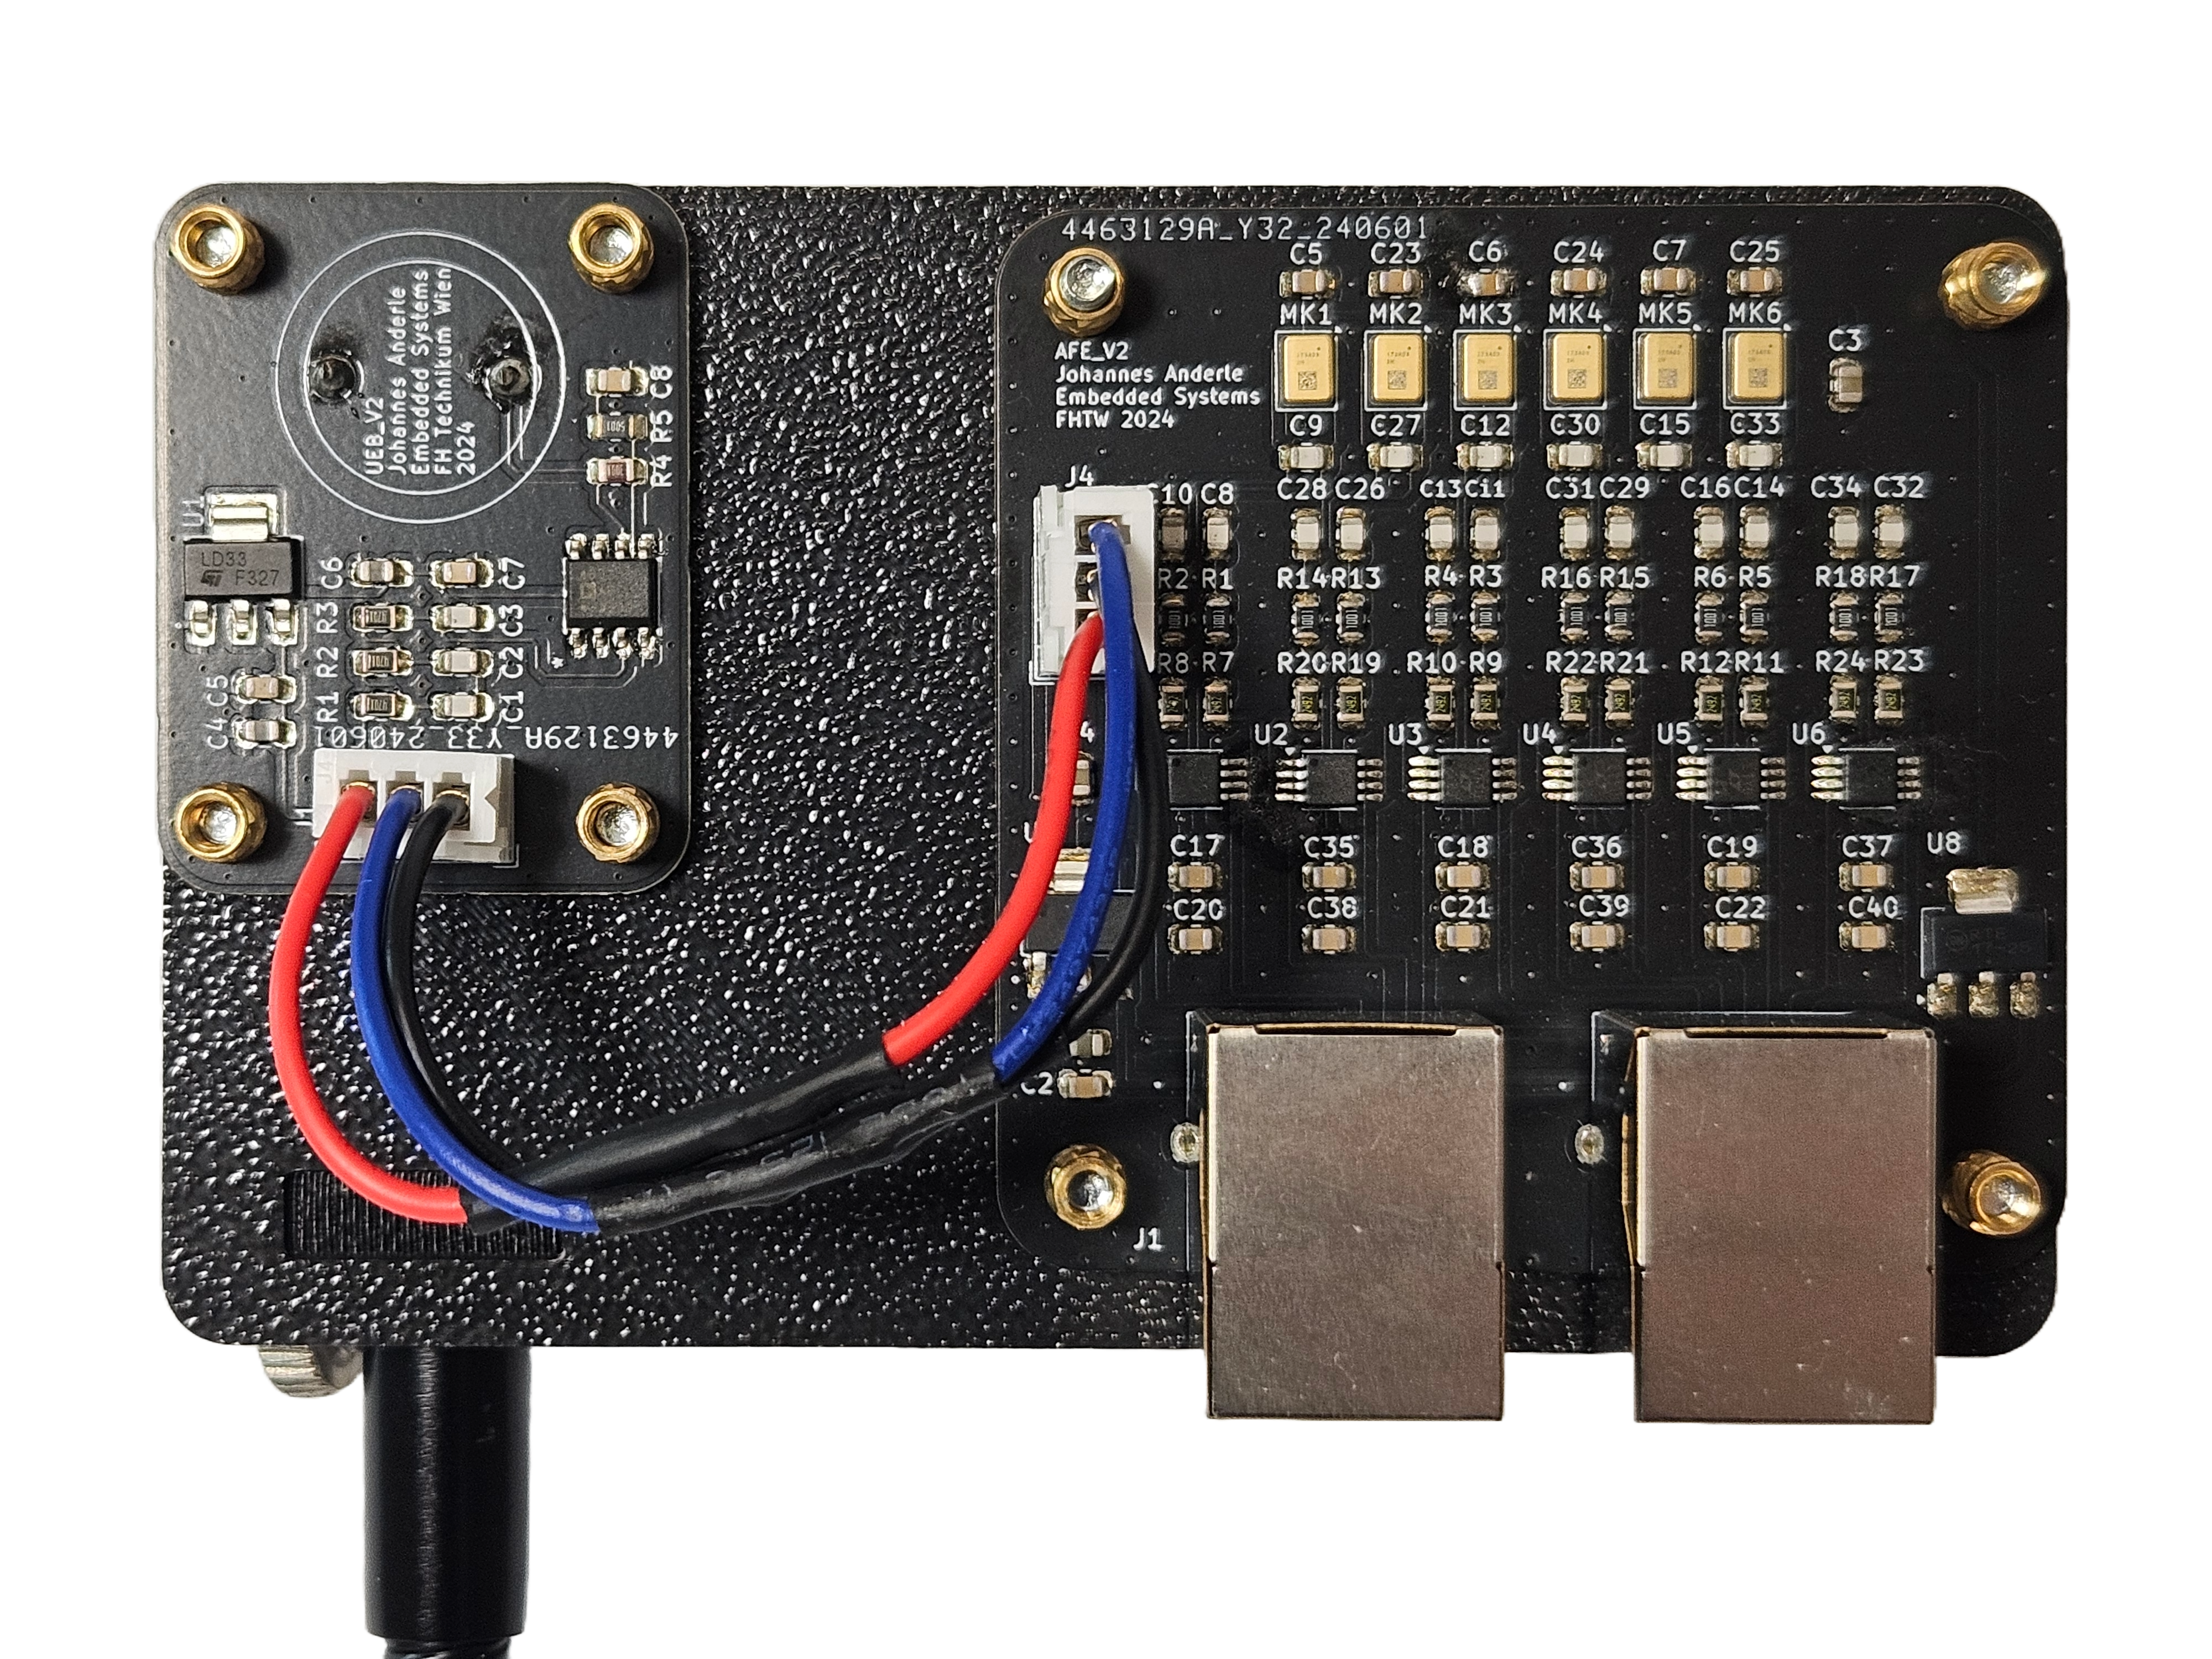
This positioning of the emitters and microphones allows for the future implementation of linear beamforming.
Base Station Configuration
The sensor head is mounted on a flexible rod for easy positioning. The silver cylinder is a weighted metal base with vibration damping feet, designed to eliminate external vibrations that could introduce errors into the measurements.
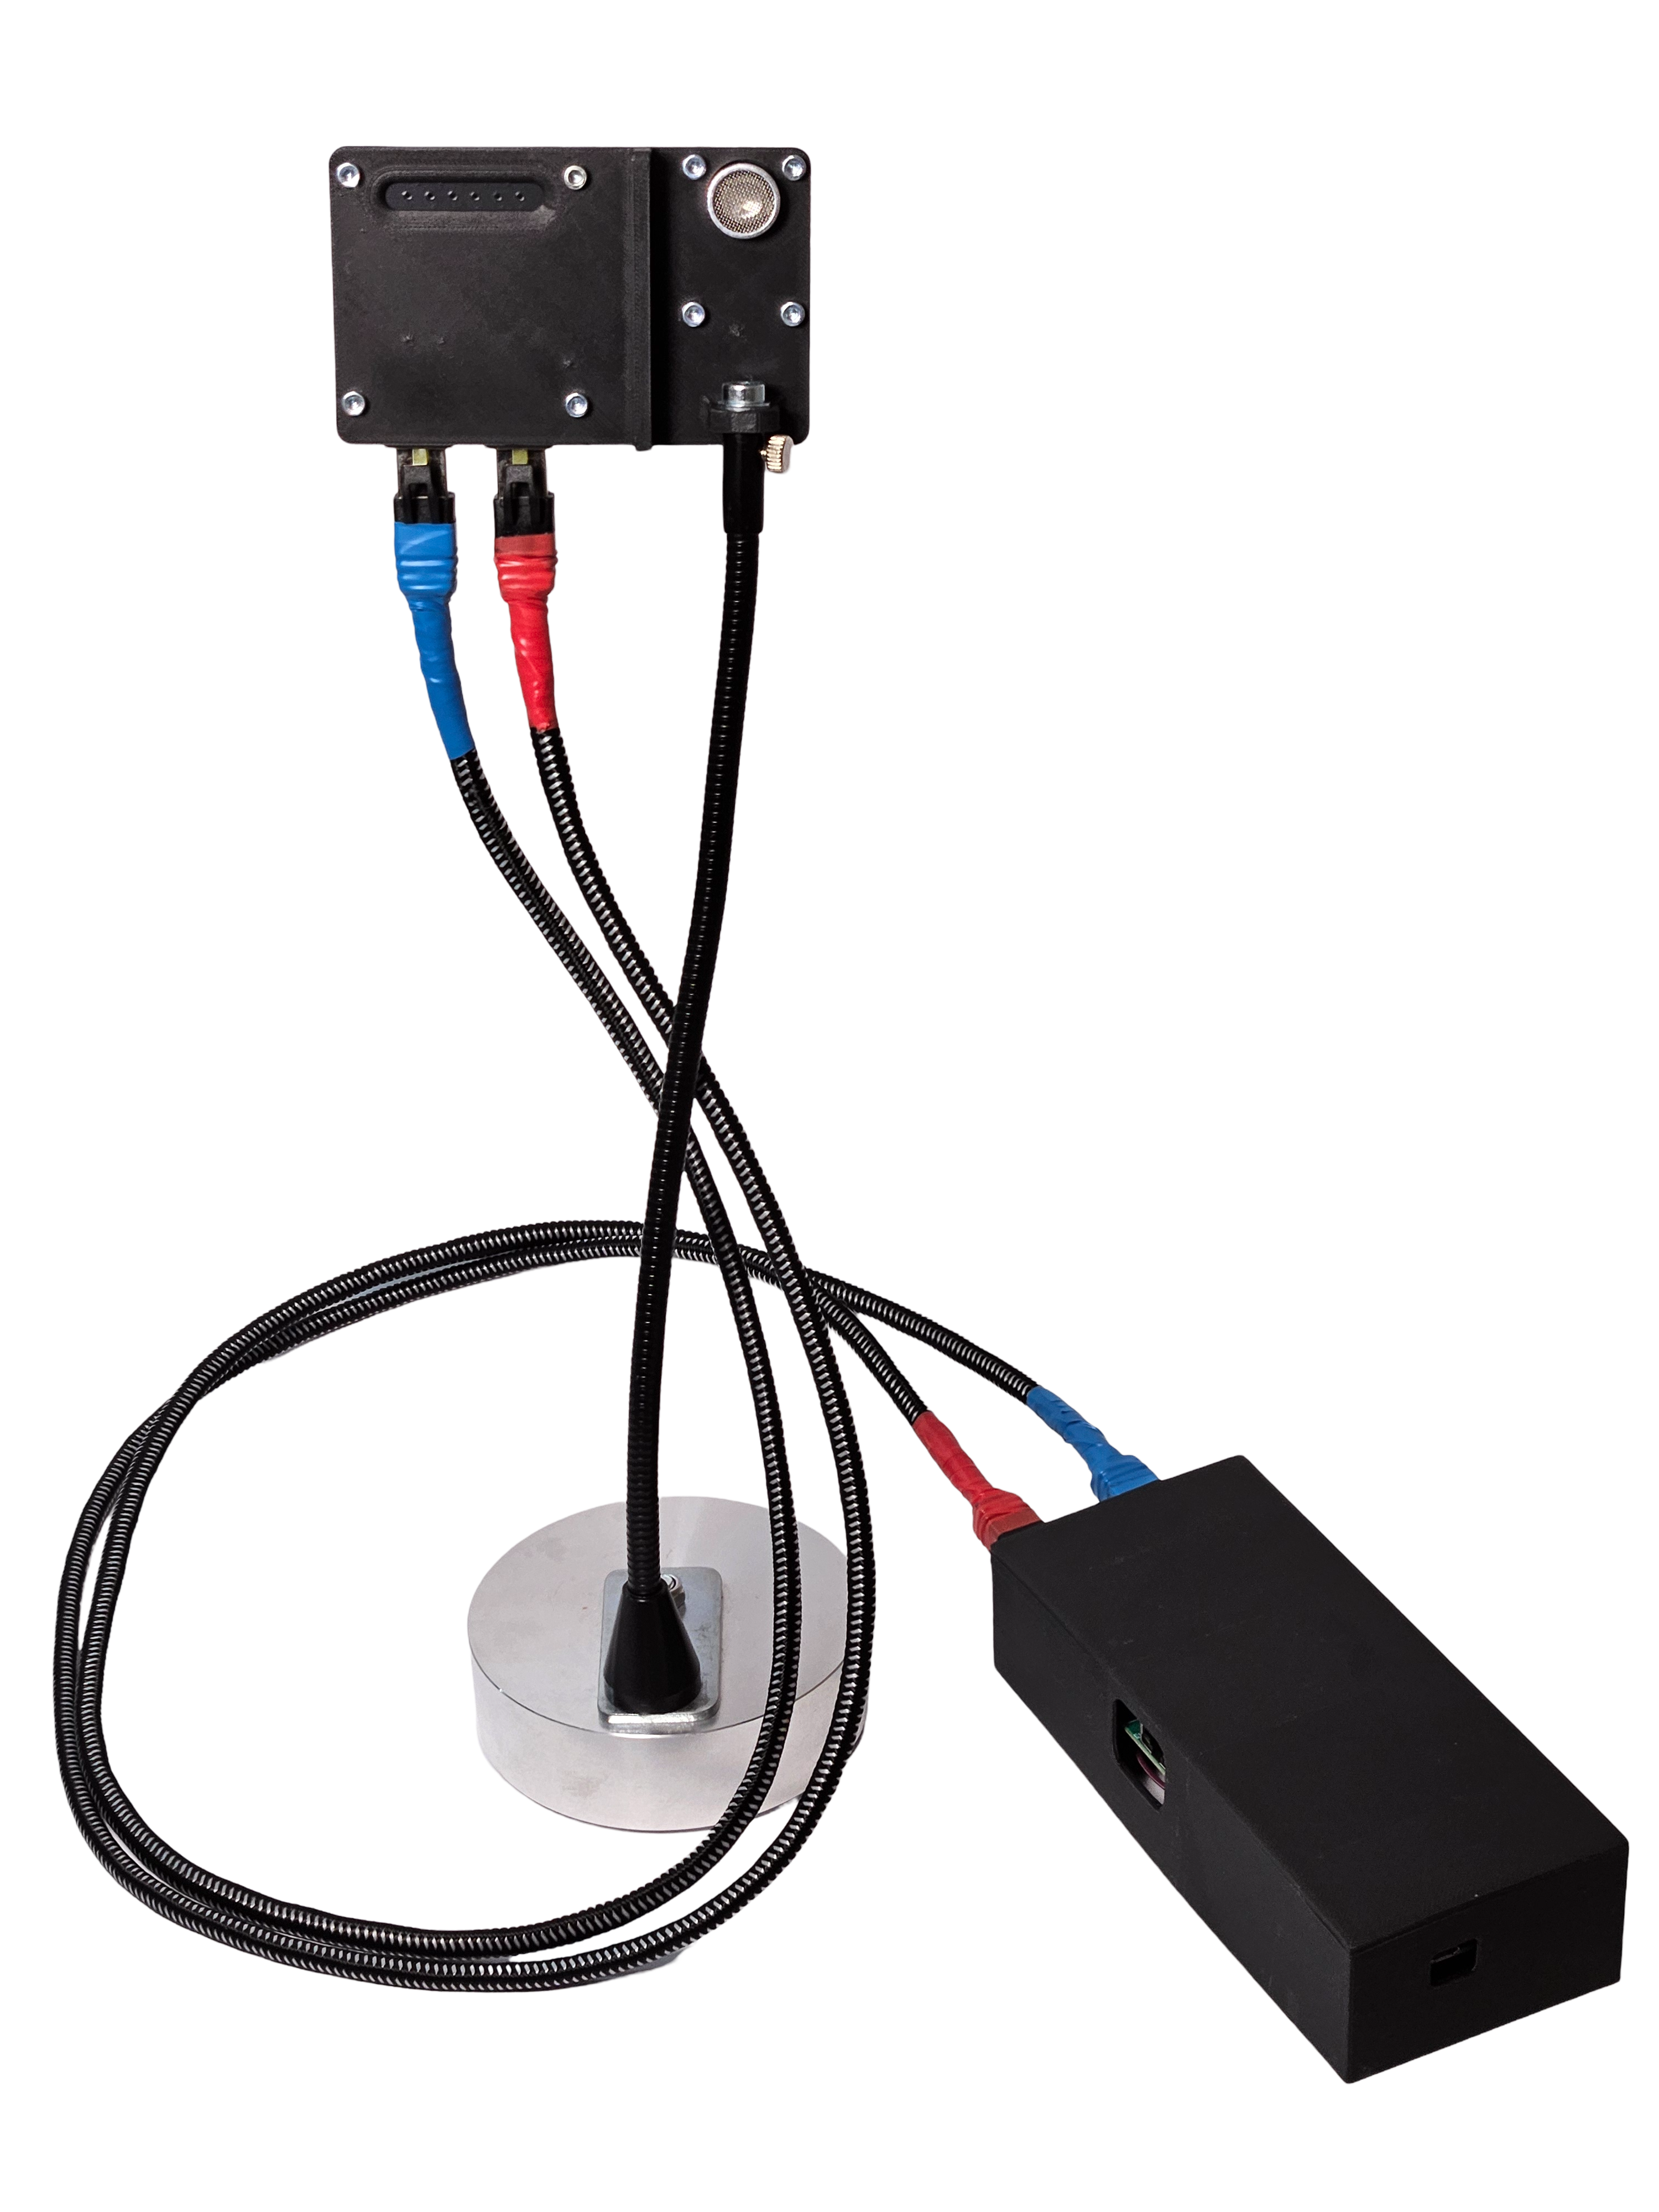
Not shown in the figure above are the micro USB and Ethernet cables connecting the PC to the setup.
Measurement and Validation Tests (by Mr. Anderle 2024)
Several tests are carried out to validate the final setup. First, the phantom test from the work of Ambrosanio et al. is repeated. Then, as in previous reports, the pulse of a subject is measured. The final step in the validation process is a combined measurement using an ECG on the subject.
Phantom Test Measurement
For these measurements, the sensor head is positioned 20 cm in front of a loudspeaker. In contrast to the work of Ambrosanio et al., components are deliberately misaligned by a few degrees. This results in an inhomogeneous reflection, as illustrated in the following experiments. The loudspeaker is connected to a signal generator, the RIGOL DG4062.
The signal generator is initially configured with the following parameters: Waveform: Sine, Frequency: 10 Hz, Amplitude: 5 V. The figure below shows the recorded reflections for channels 0 to channel 5.
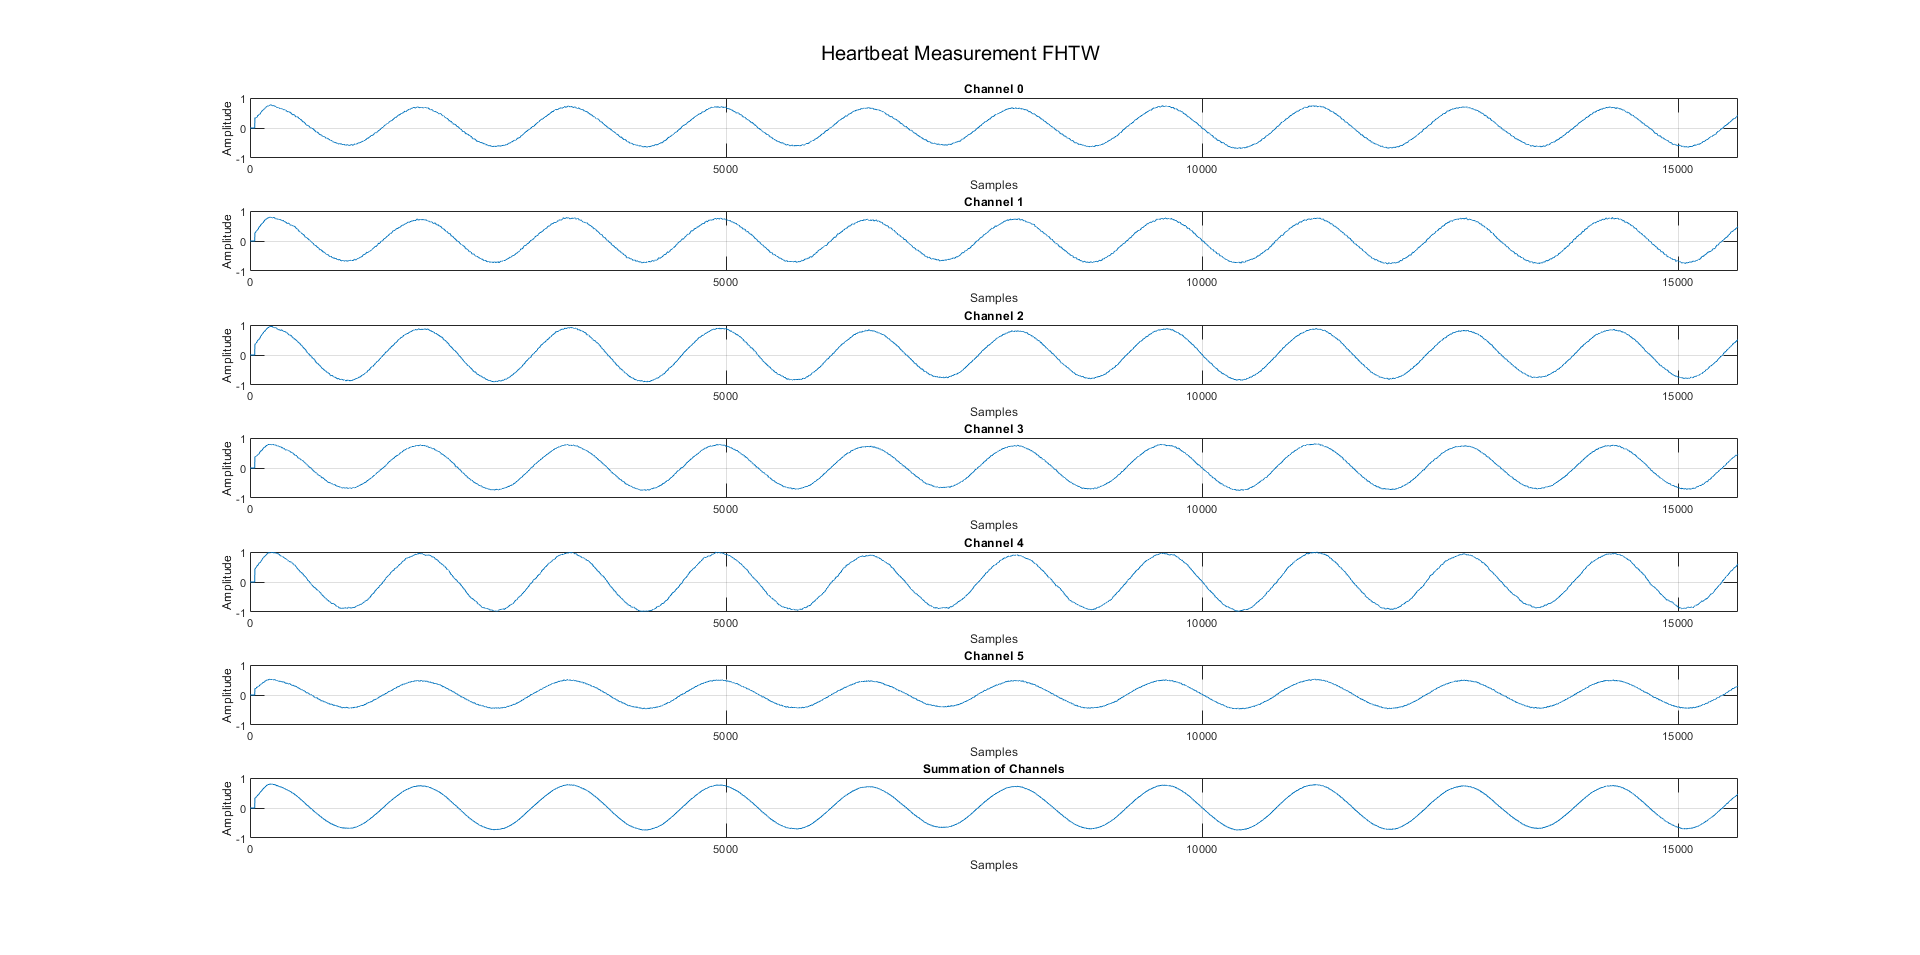
The last plot is an average of all channels. Comparing channel 4 with channel 5, it is evident that the amplitude of the received signals is different, indicating that the reflected signal is concentrated at a narrow angle.
If the sensor head position is slightly adjusted, the signal remains measurable, but the amplitude of the individual channels changes, as shown in the figure below.
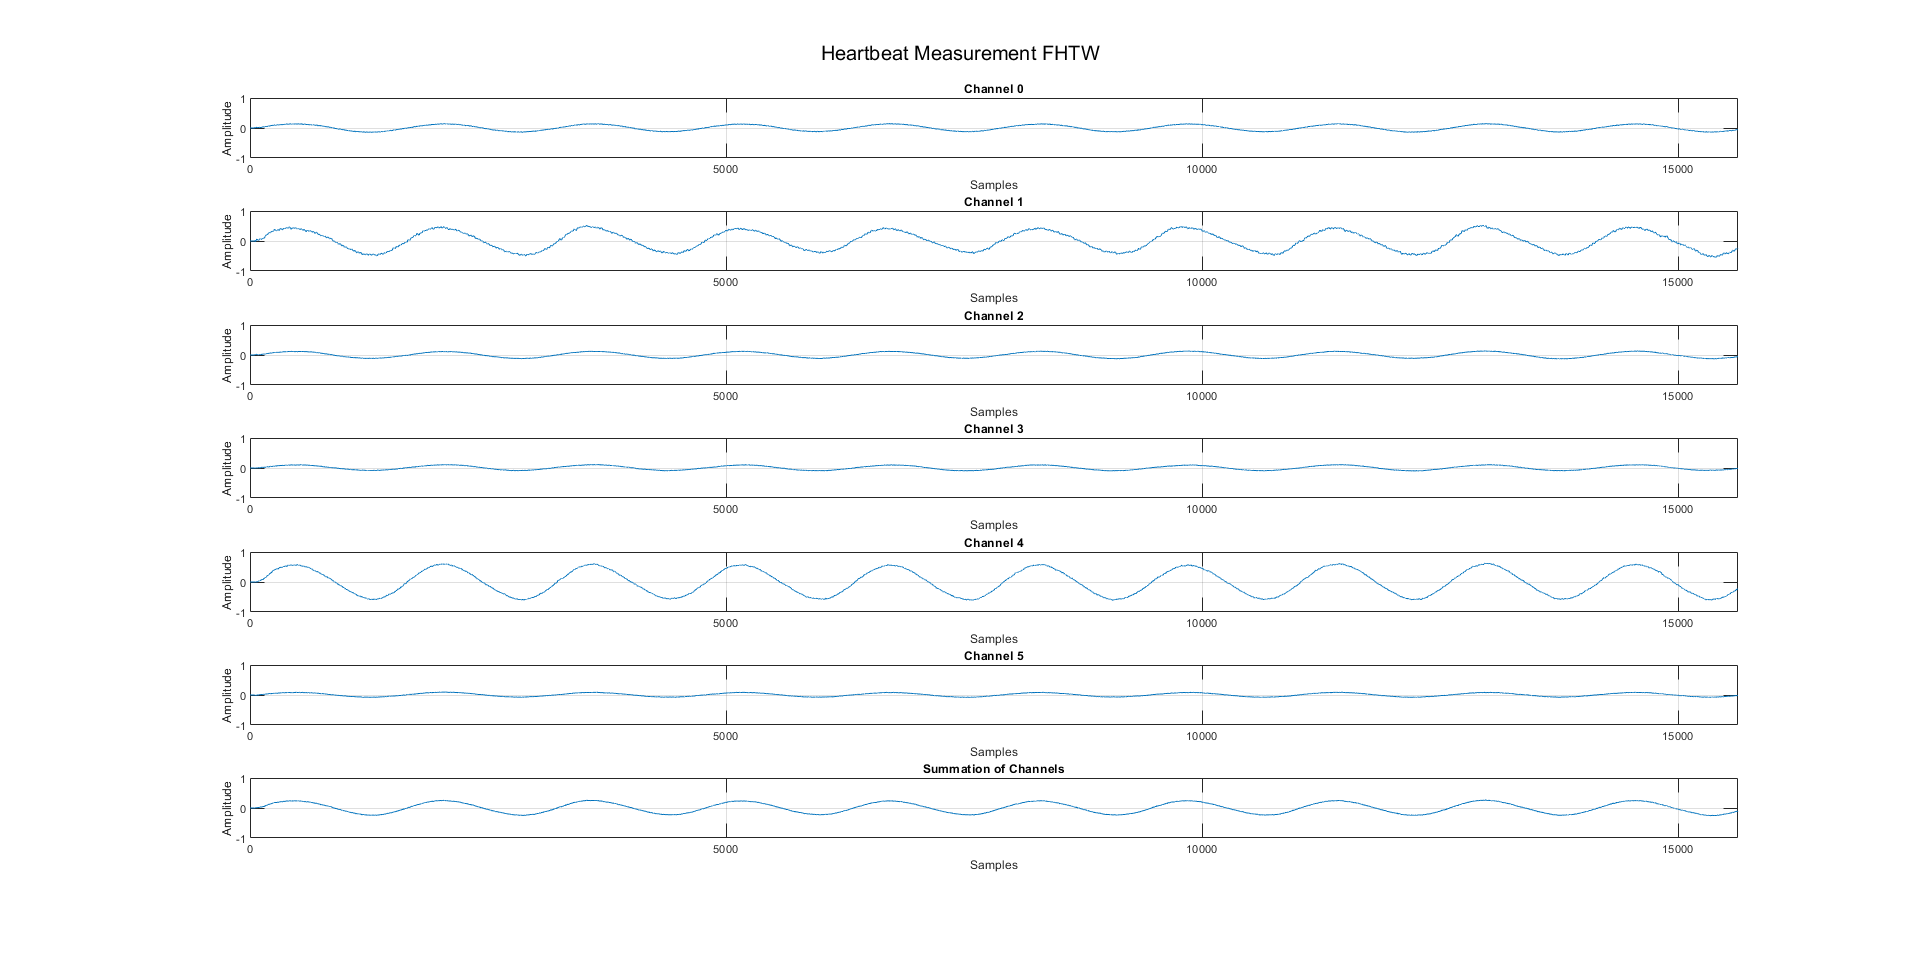
Channels 4 and 5 behave similarly, but the amplitude of channels 0, 2, and 3 is reduced. As seen in the last plot, averaging over all channels can lead to misleading results.
With the same hardware setup, the signal generator is adjusted to a new configuration: Waveform: Sine, Pulse: 2 Hz, Amplitude: 5 V, Duty: 10%. This produces a short pulse waveform, with the membrane of the loudspeaker being pulled and pushed towards the sensor head. The following figure shows two identical pulses captured during the test.
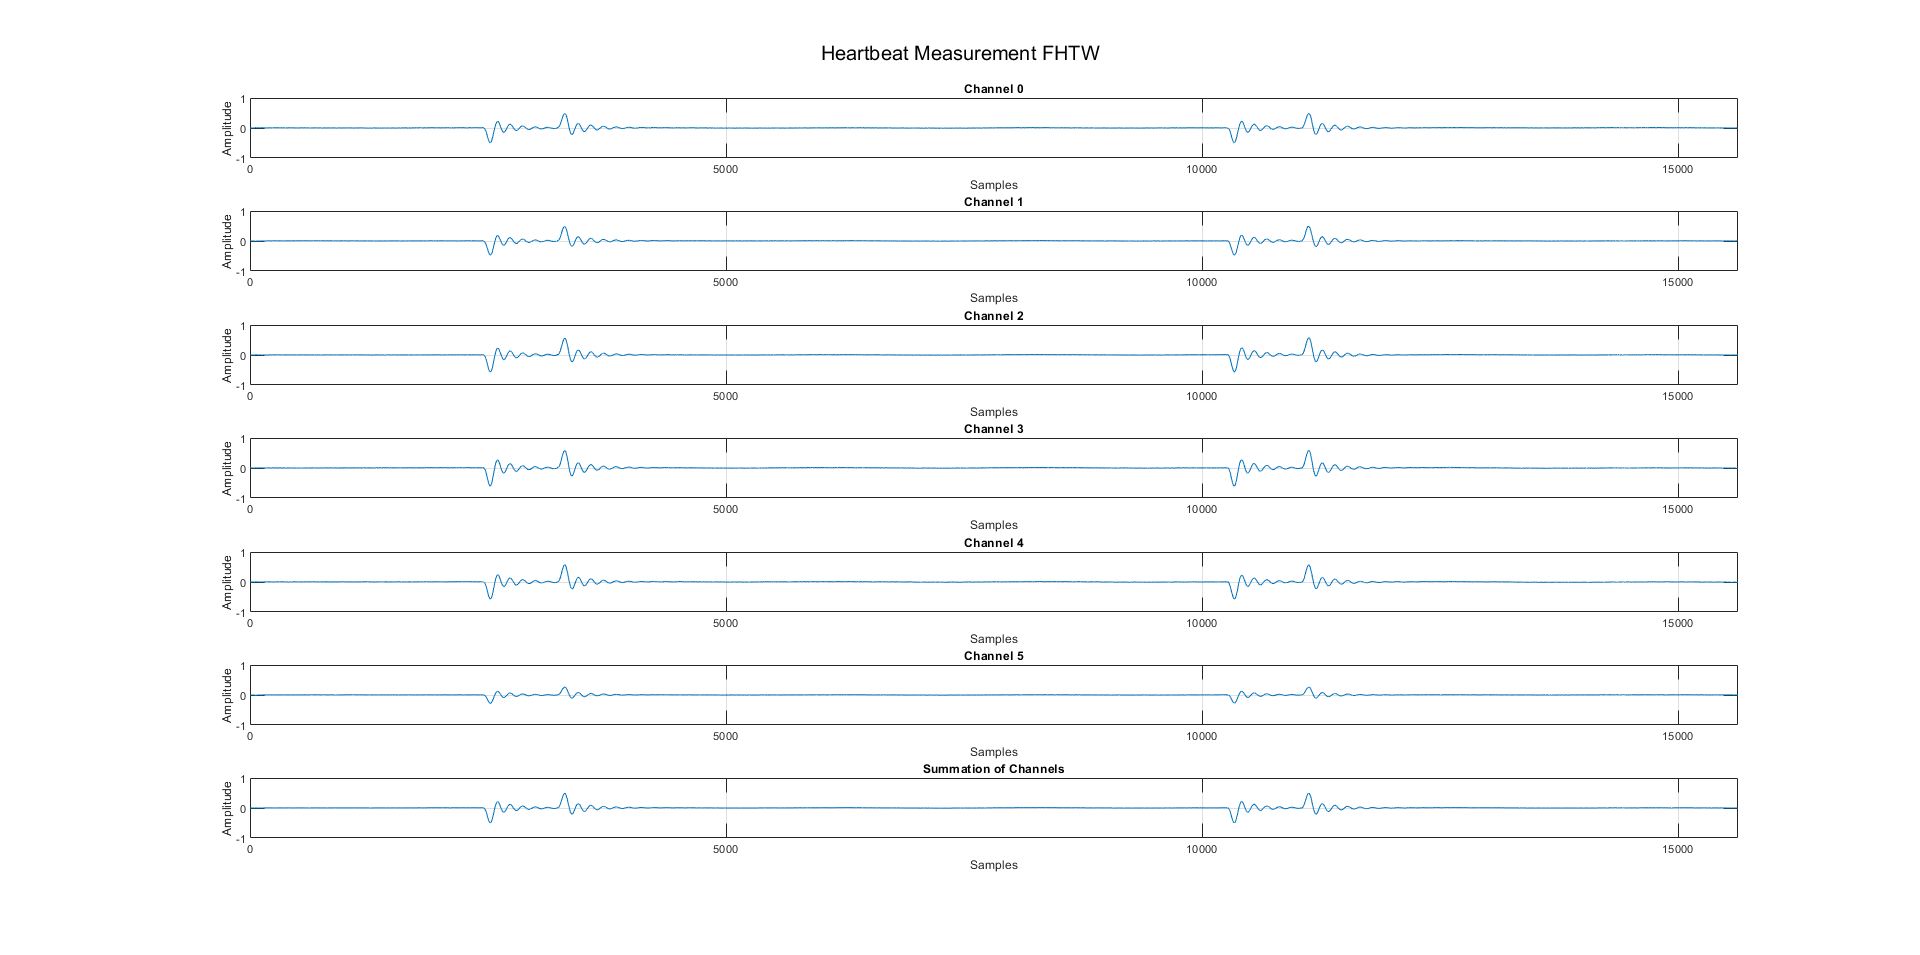
The pulse waveform begins with a drop, reflecting the membrane moving away from the sensor head, followed by a rise as the membrane moves towards the sensor head. This confirms the accuracy of the motion detection. The movements of the speaker are almost impossible to detect by touch, demonstrating the high sensitivity of the system.
Pulse Measurement of Subject
This test is conducted under the same conditions as in previous reports. The subject sits upright in a chair, breathing normally, and is encouraged to remain as still as possible. The sensor head is placed 20 cm from the carotid artery on the right side of the neck. The detected heartbeat is shown in the figure below.
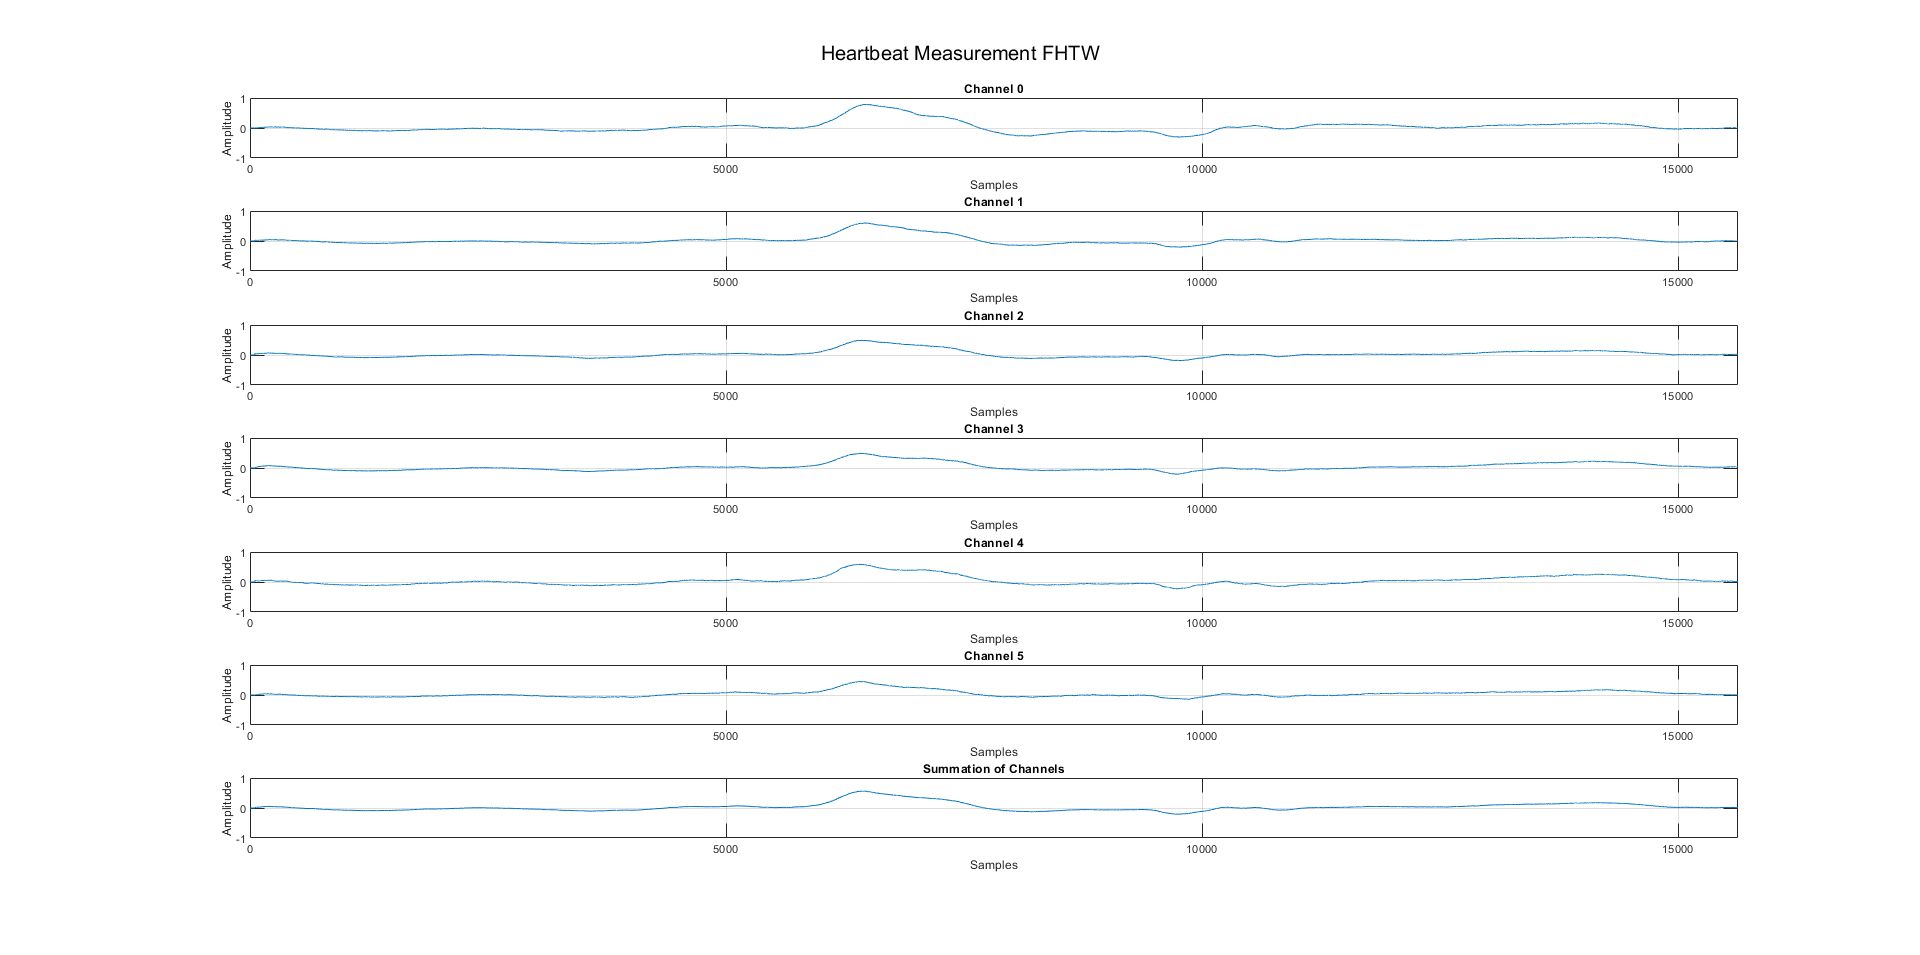
The heartbeat is indicated by a peak in the signal wave at sample 6000. Elastic blood vessels cause small oscillations, seen between samples 8000 and 10000. Since the neck artery is less flat than a loudspeaker membrane, the directionality of the reflected signals is less of an issue. Beamforming methods could significantly enhance sensitivity and are a subject for further research.
Detecting a single heartbeat is a major achievement, but monitoring heartbeats over time is more significant. The figure below shows data recorded over a longer period.
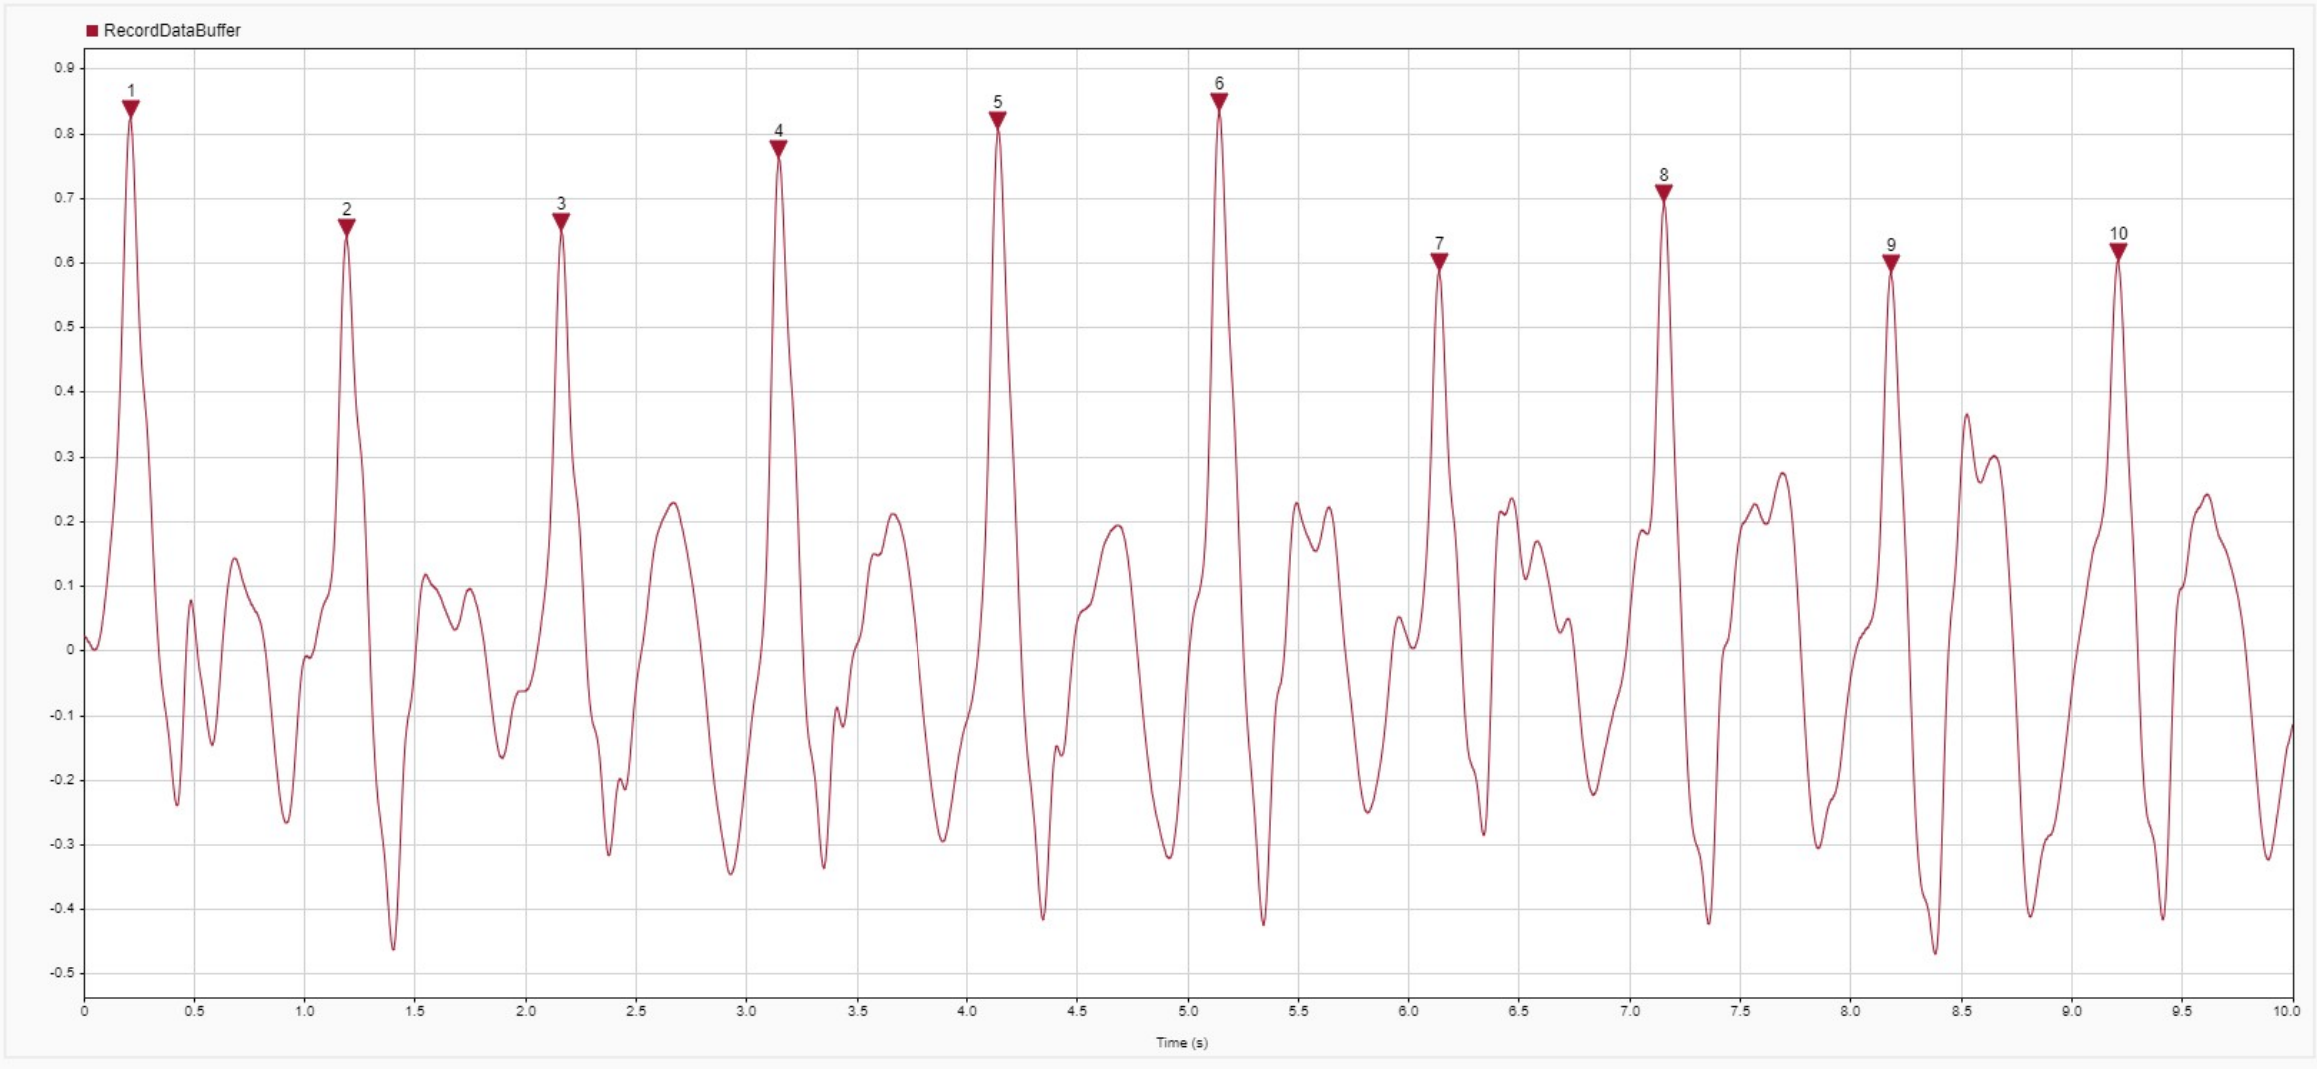
The peaks representing each heartbeat are marked. With 10 heartbeats recorded in 10 seconds, the subject's heart rate is approximately 60 beats per minute. A pulse oximeter reading showed 63 beats per minute, confirming the accuracy of the setup.
Validation with ECG Measurement
The final validation test involves the same setup but includes an ECG for comparison. The ECG is an AD8232 breakout board connected to an Arduino Nano Every. The Arduino samples the ECG at 50 Hz and transmits the data via USB-UART to a Matlab script. Both the ECG signal (red) and the sensor head signal (blue) are superimposed on the same graph for comparison, as shown in the figure below.
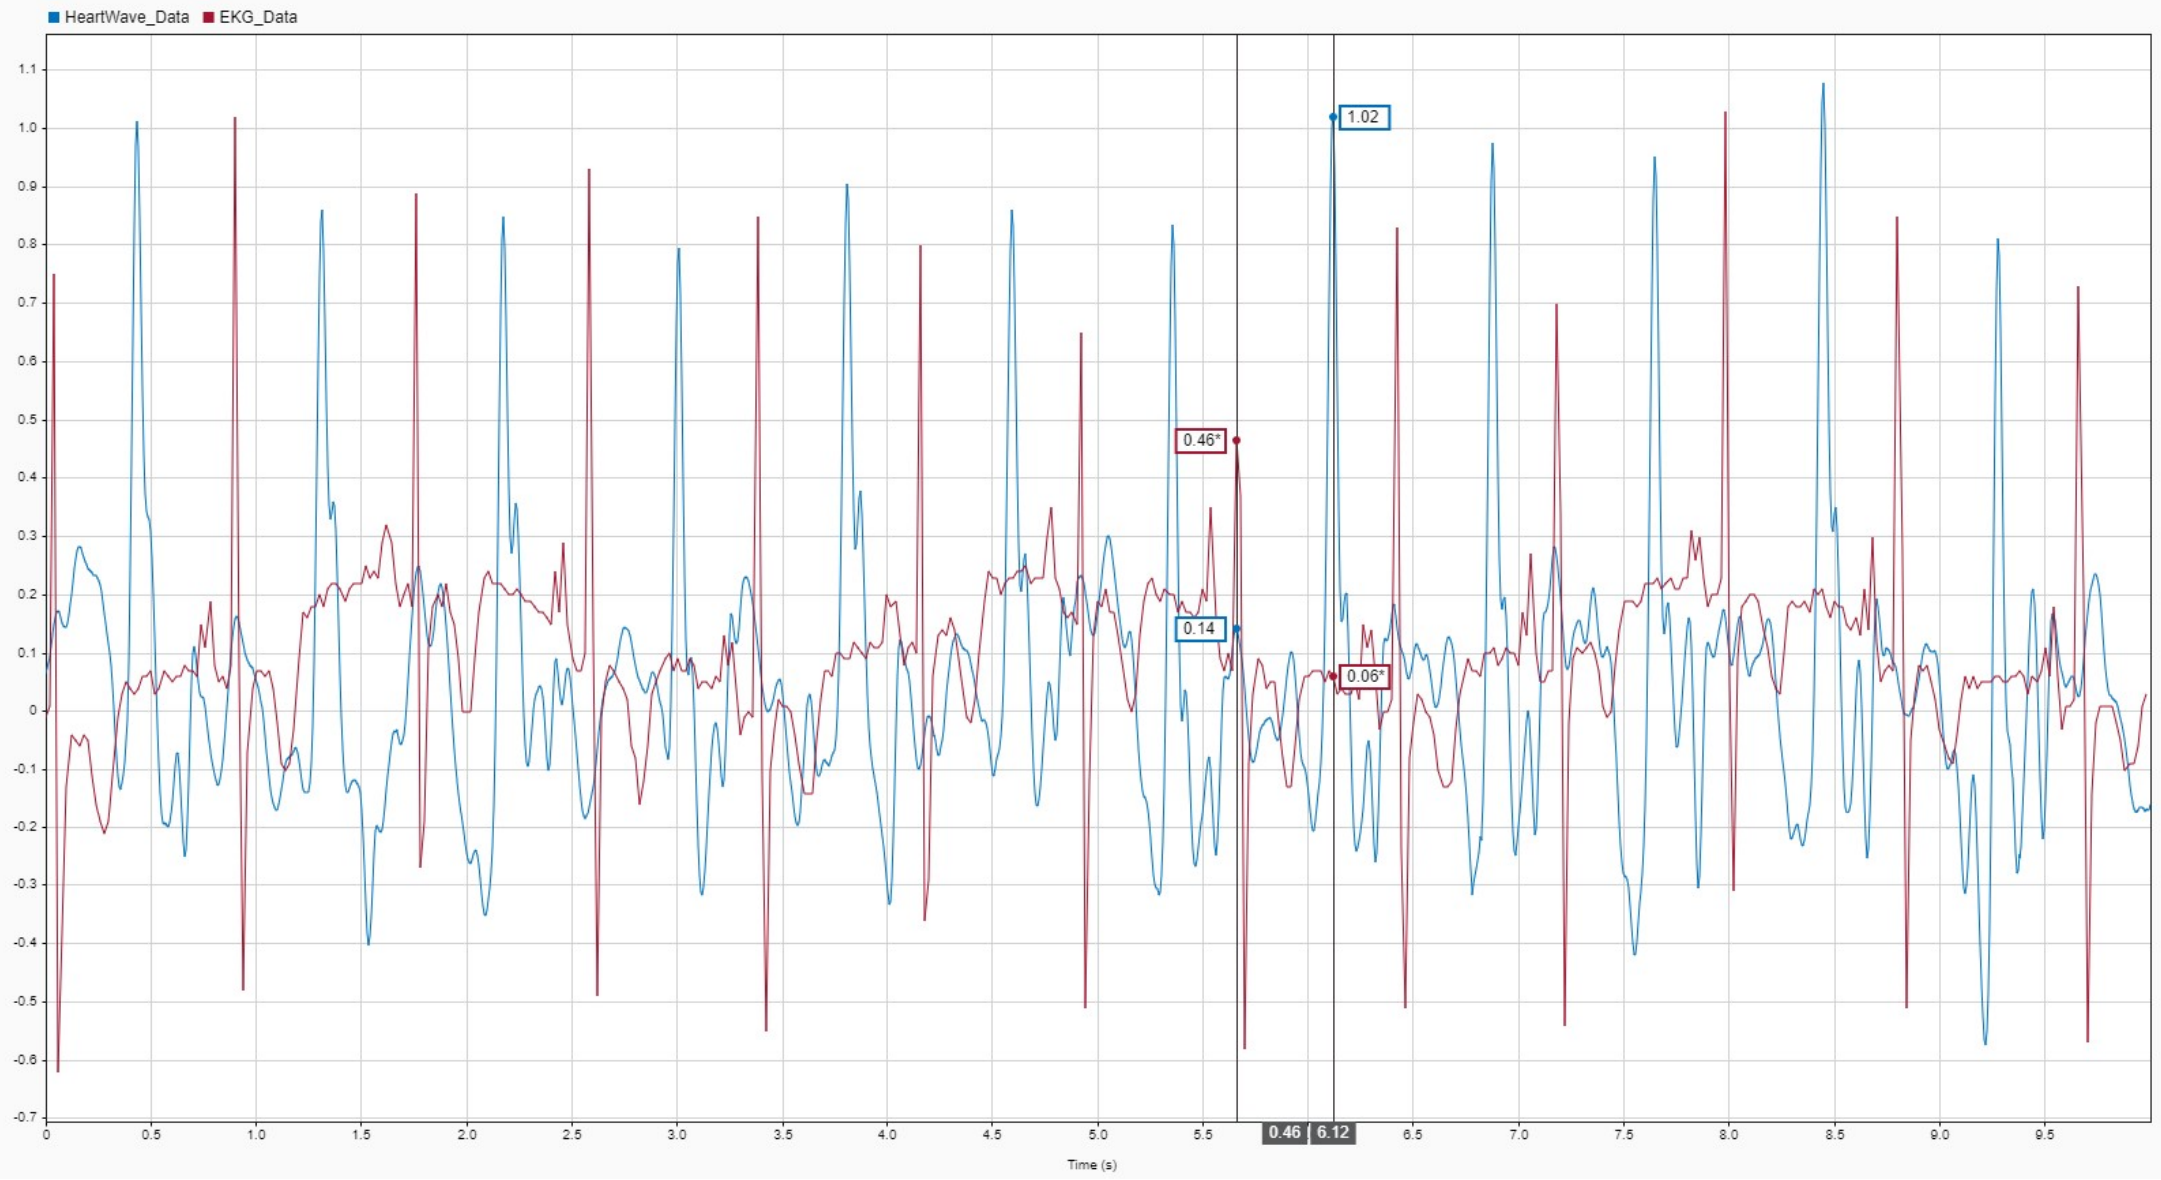
Initially, the results seem unusual, with a large gap of nearly half a second between peaks. This is due to the different data storage methods: the sensor head signal is sampled at 15625 Hz over UDP, while the ECG signal is sampled at 50 Hz over UART, resulting in a constant delay of 350 mS.
By shifting the ECG signal to compensate for the delay, the results become more aligned. The figure below shows that the longest delay between two peaks is now 80 mS.
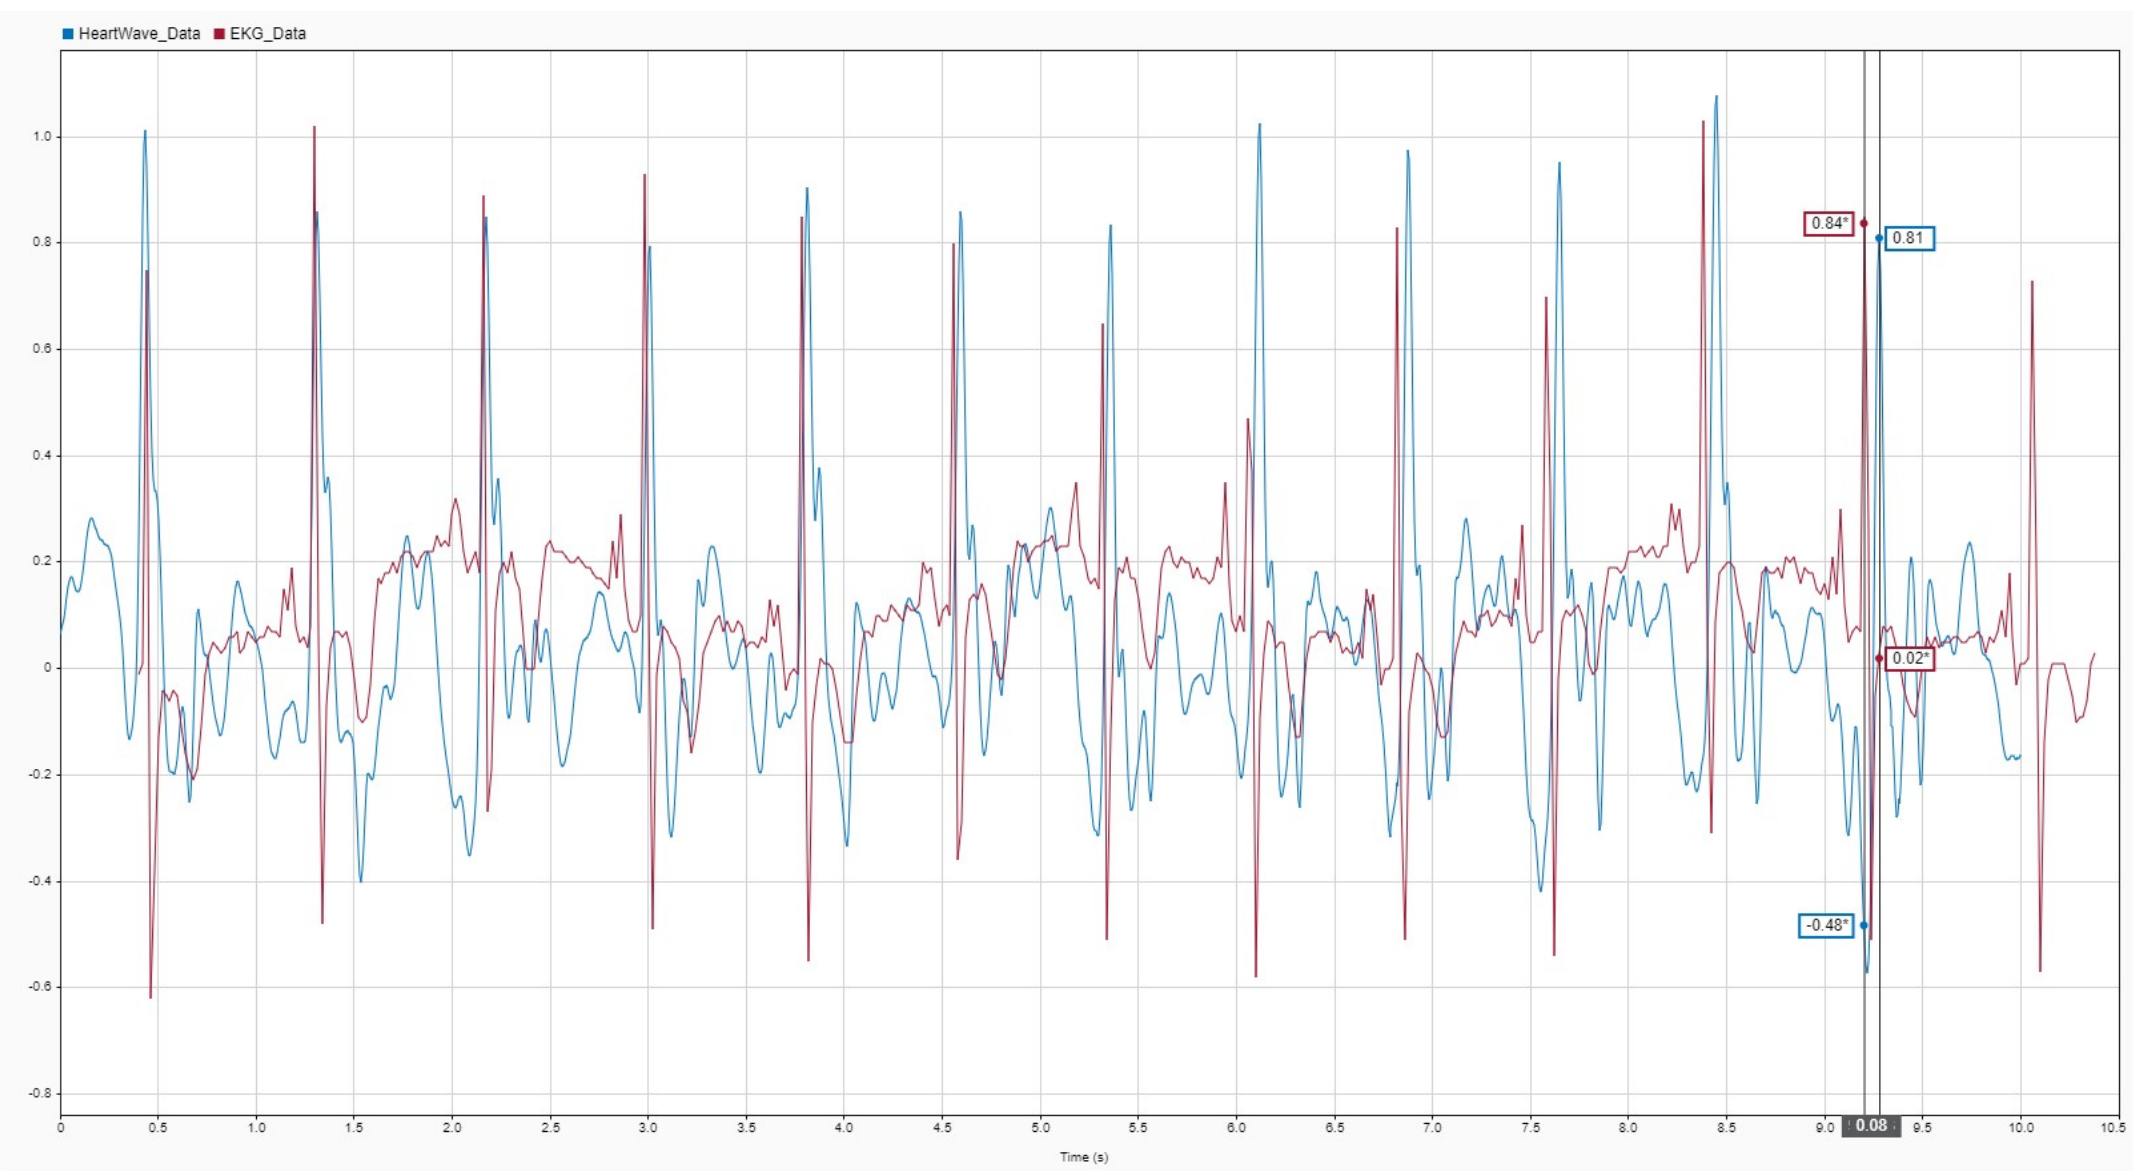
The natural delay between the ECG and sensor head signals varies depending on the subject. Accurate average delays can only be evaluated by averaging multiple test samples. The validation involves aligning as many peaks as possible and calculating the average deviation. With a maximum deviation of ±80 mS, the setup is capable of determining beats per minute with the same accuracy as a pulse oximeter. Initial test data suggests that the system can measure heart rate with comparable accuracy to the AD8232 ECG breakout board.
Hardware Setup and initial testing of the AFE V1 and UEB V1 hardware platforms (by Mr. Anderle/Mr. Tenta 2024)
The setup includes a base station containing the Aurix LiteKit V2, a sensor head, and connection cables equipped with Phoenix plugs for easy disconnection and transport. The six signal wires, organized in twisted pairs to minimize crosstalk, each carry the differential signal of one EDSADC channel. All parts are 3D printed using black PLA from Polyterra, utilizing default settings.
Sensor Head
The sensor head carries the three AFE_V1 and the UEB_V1, as shown in the figure below.
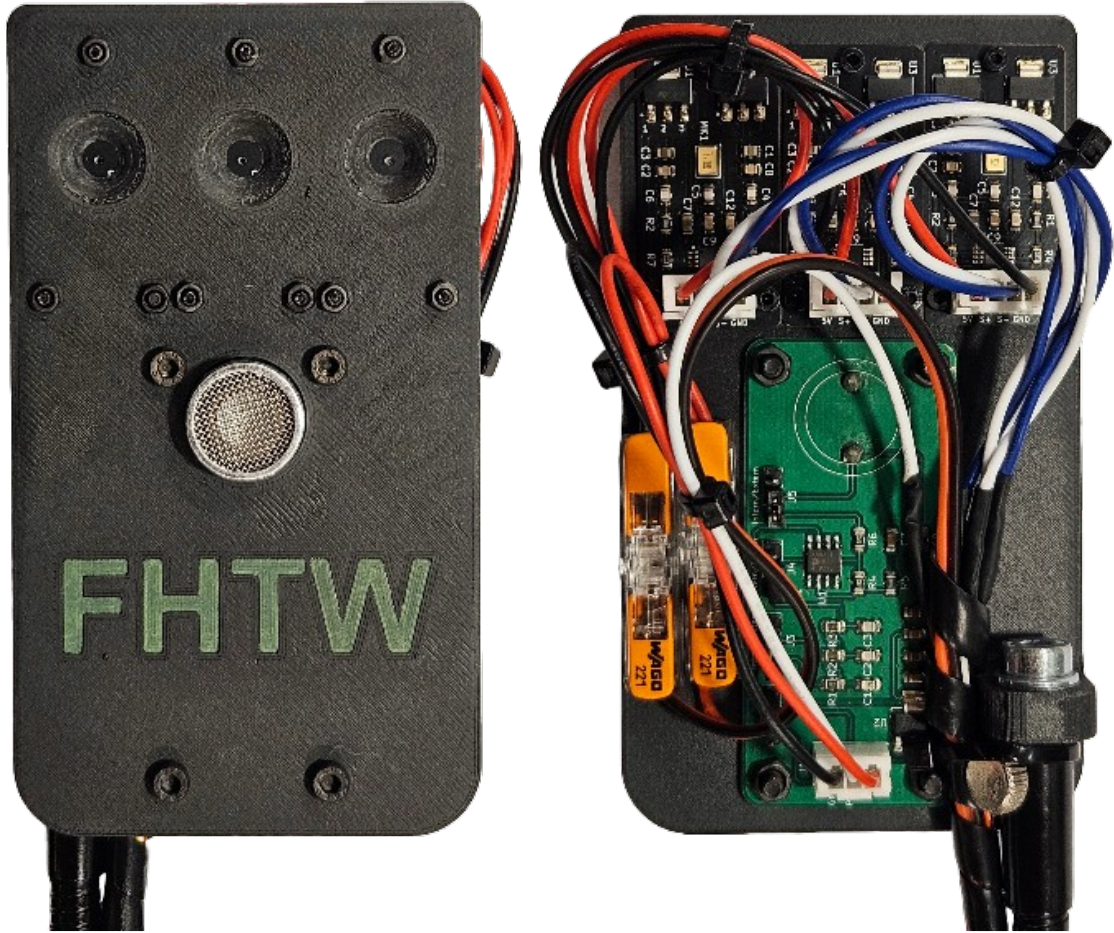
The AFE_V1 are mounted as close together as possible. The resulting distance between the microphones of 20mm ensures a good directionality but is still too large to implement proper beamforming algorithms.
Base Station
The sensor head is mounted on a bendable rod, allowing for easy positioning. The silver cylinder is a weighted metal base with vibration-dampening feet, designed to eliminate external vibrations that could introduce errors in the measurements.
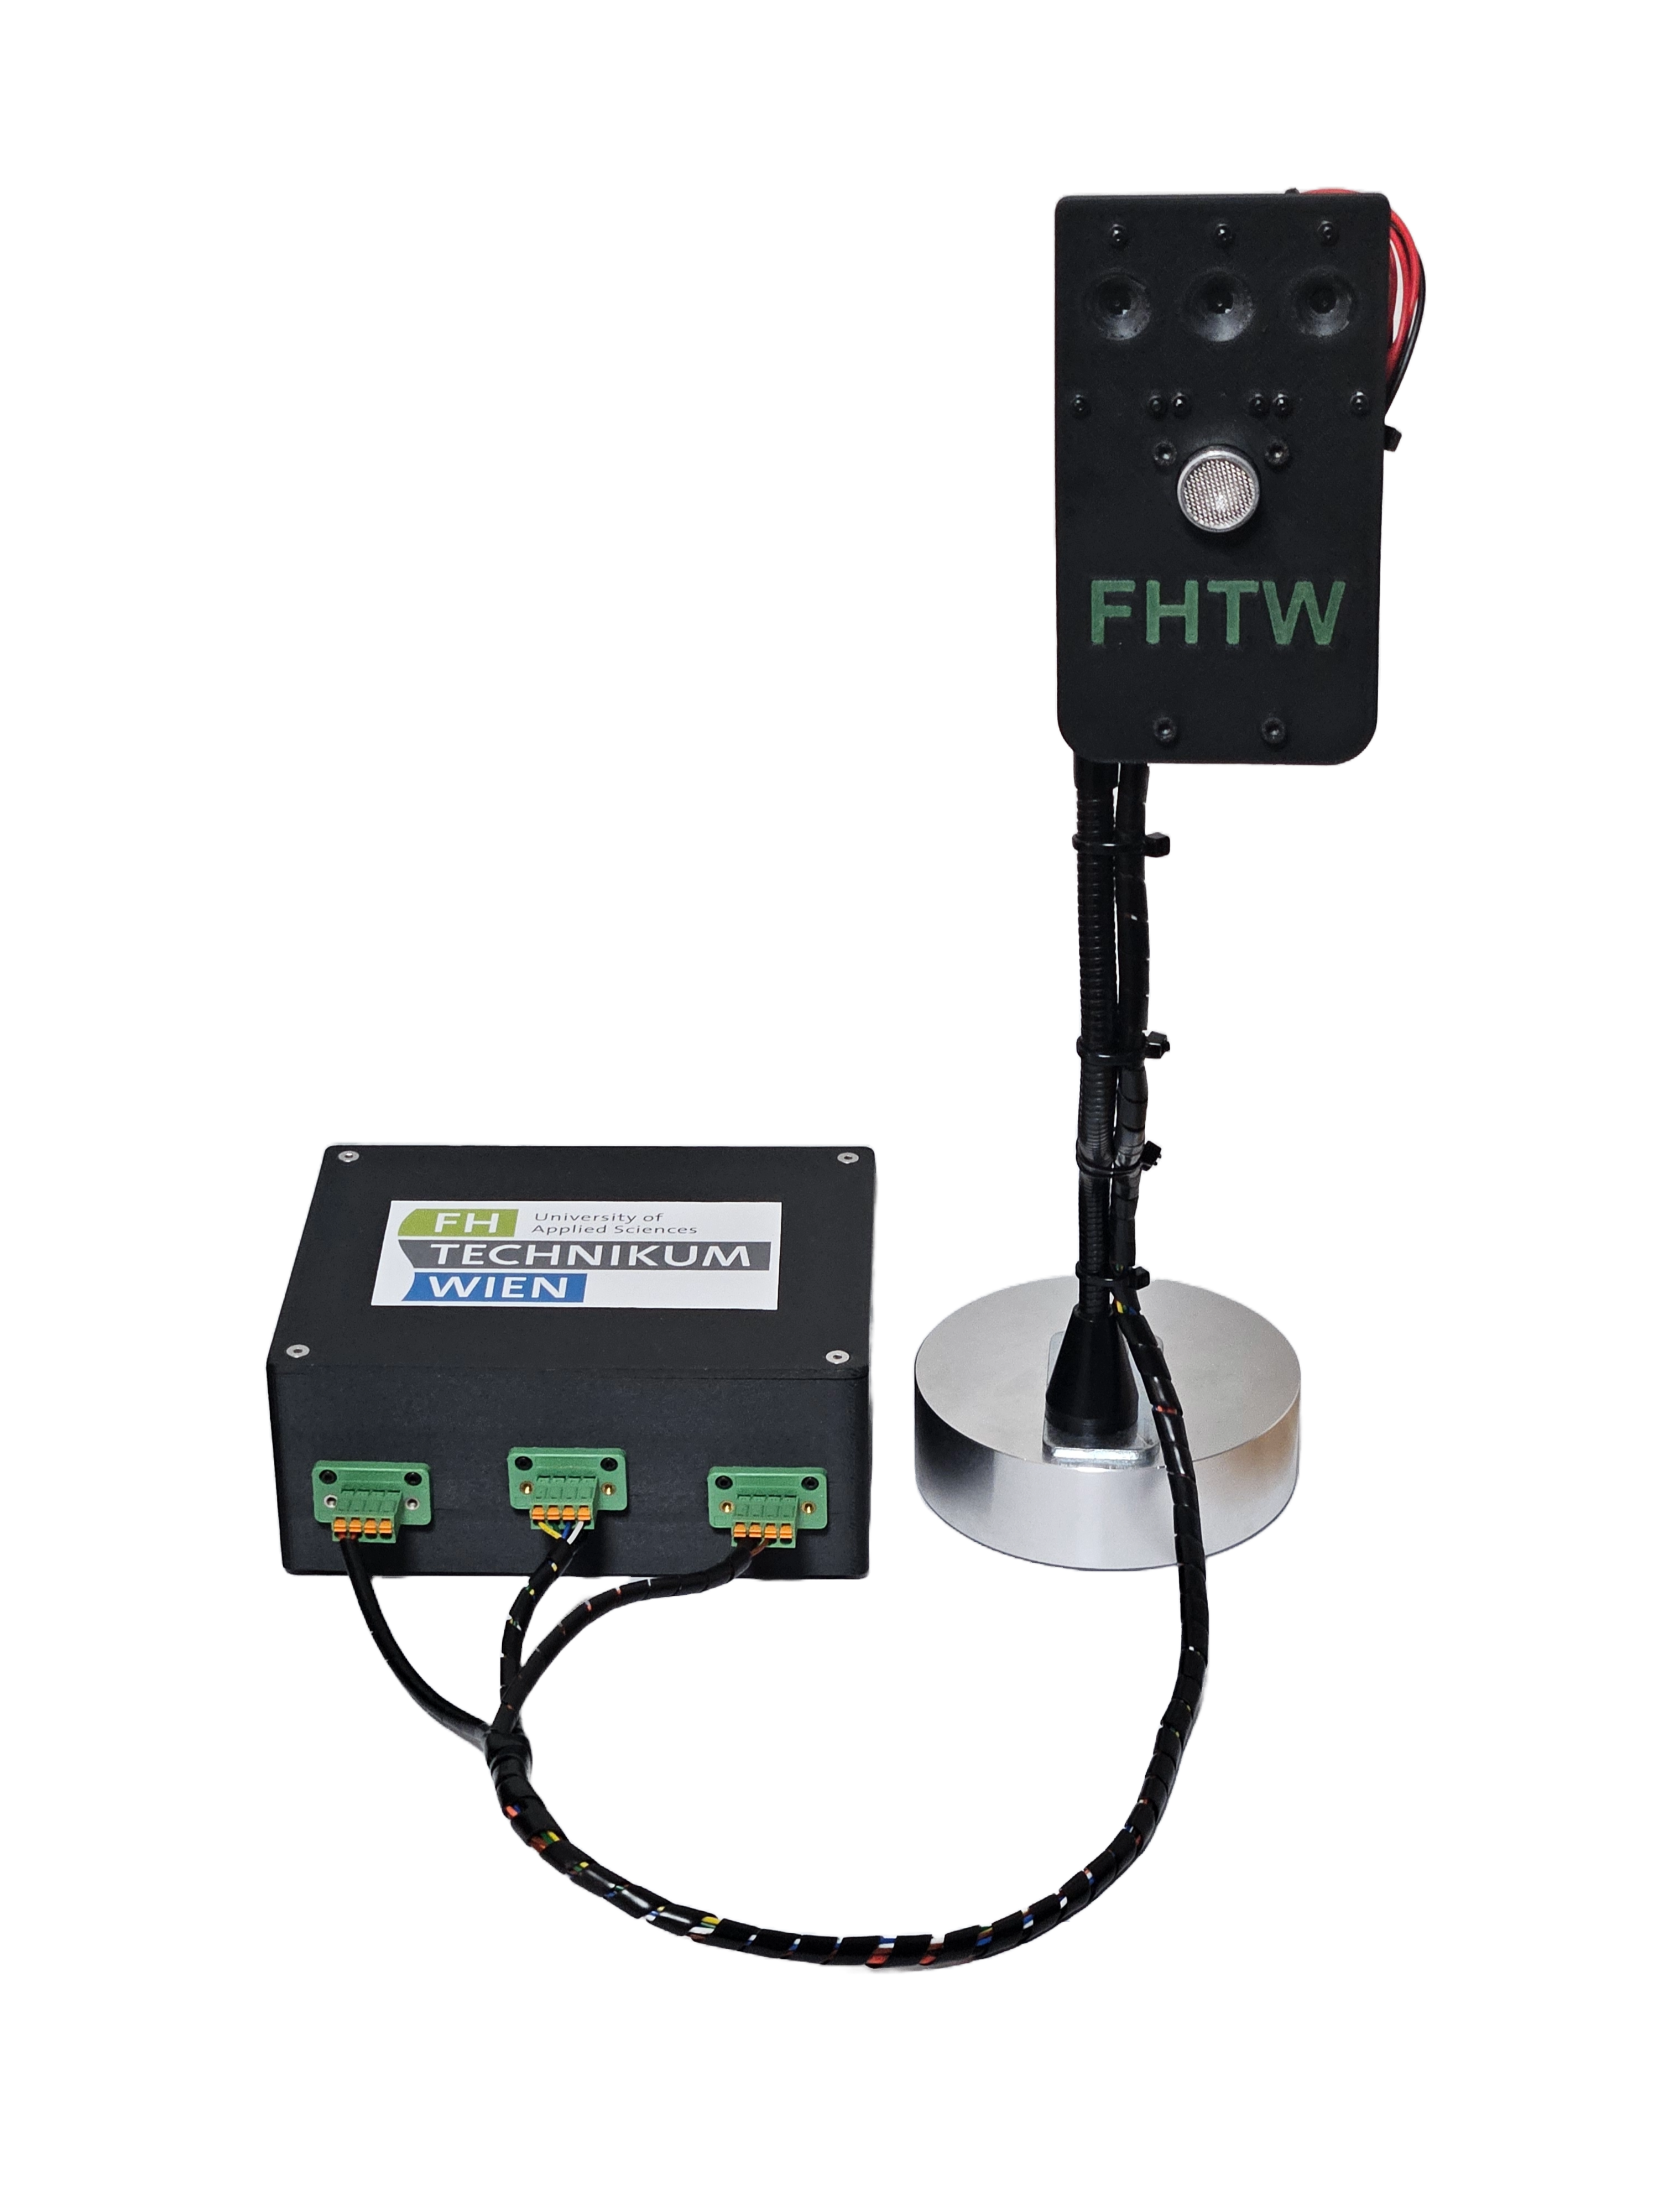
Not shown in the figure above are the micro USB and Ethernet cables.
Measurement testing and Verification
The values in Phase_Shift0 plotted over time illustrate the movement pattern of the object in front of the microphones. The sensor head, which contains three AFE_V1 and one UEB_V1, is positioned 10 cm away from the right side of the test person's neck, with the ultrasound transmitter aimed at the arteria carotis communis. The figure below displays the measured reflections from all three channels. To reduce computational load, the data is resampled so that 12,000 samples represent one second ofrecorded data. Since the microphones are mounted 2 cm apart, the reflected signals exhibit different amplitudes. The heartbeat can be clearly seen in all three channels.
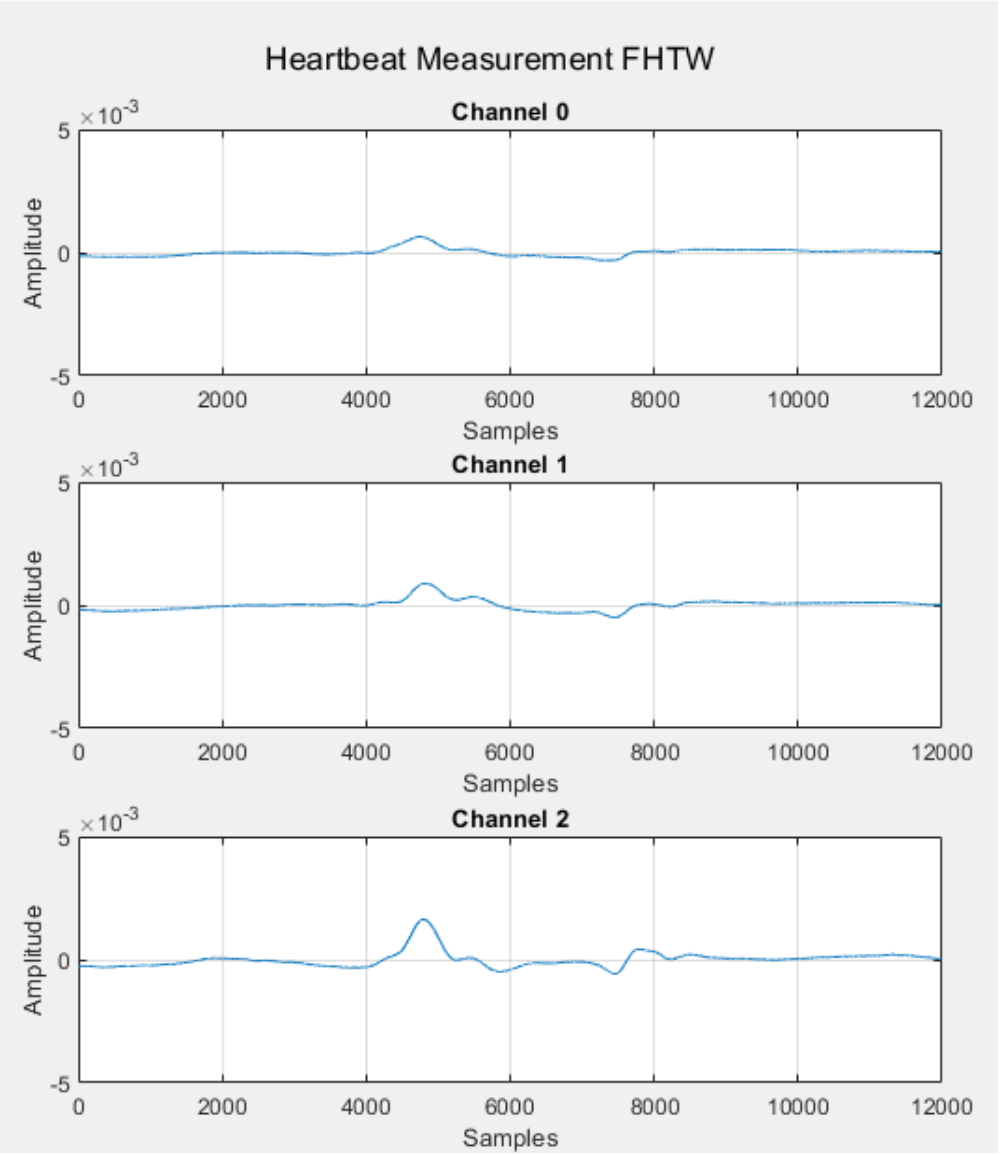
The time delay between the 3 Channels is neglectable, so the signals can be summed up to enhance the peak of the heartbeat summed up over 5 Seconds looks like as shown in the figure below.
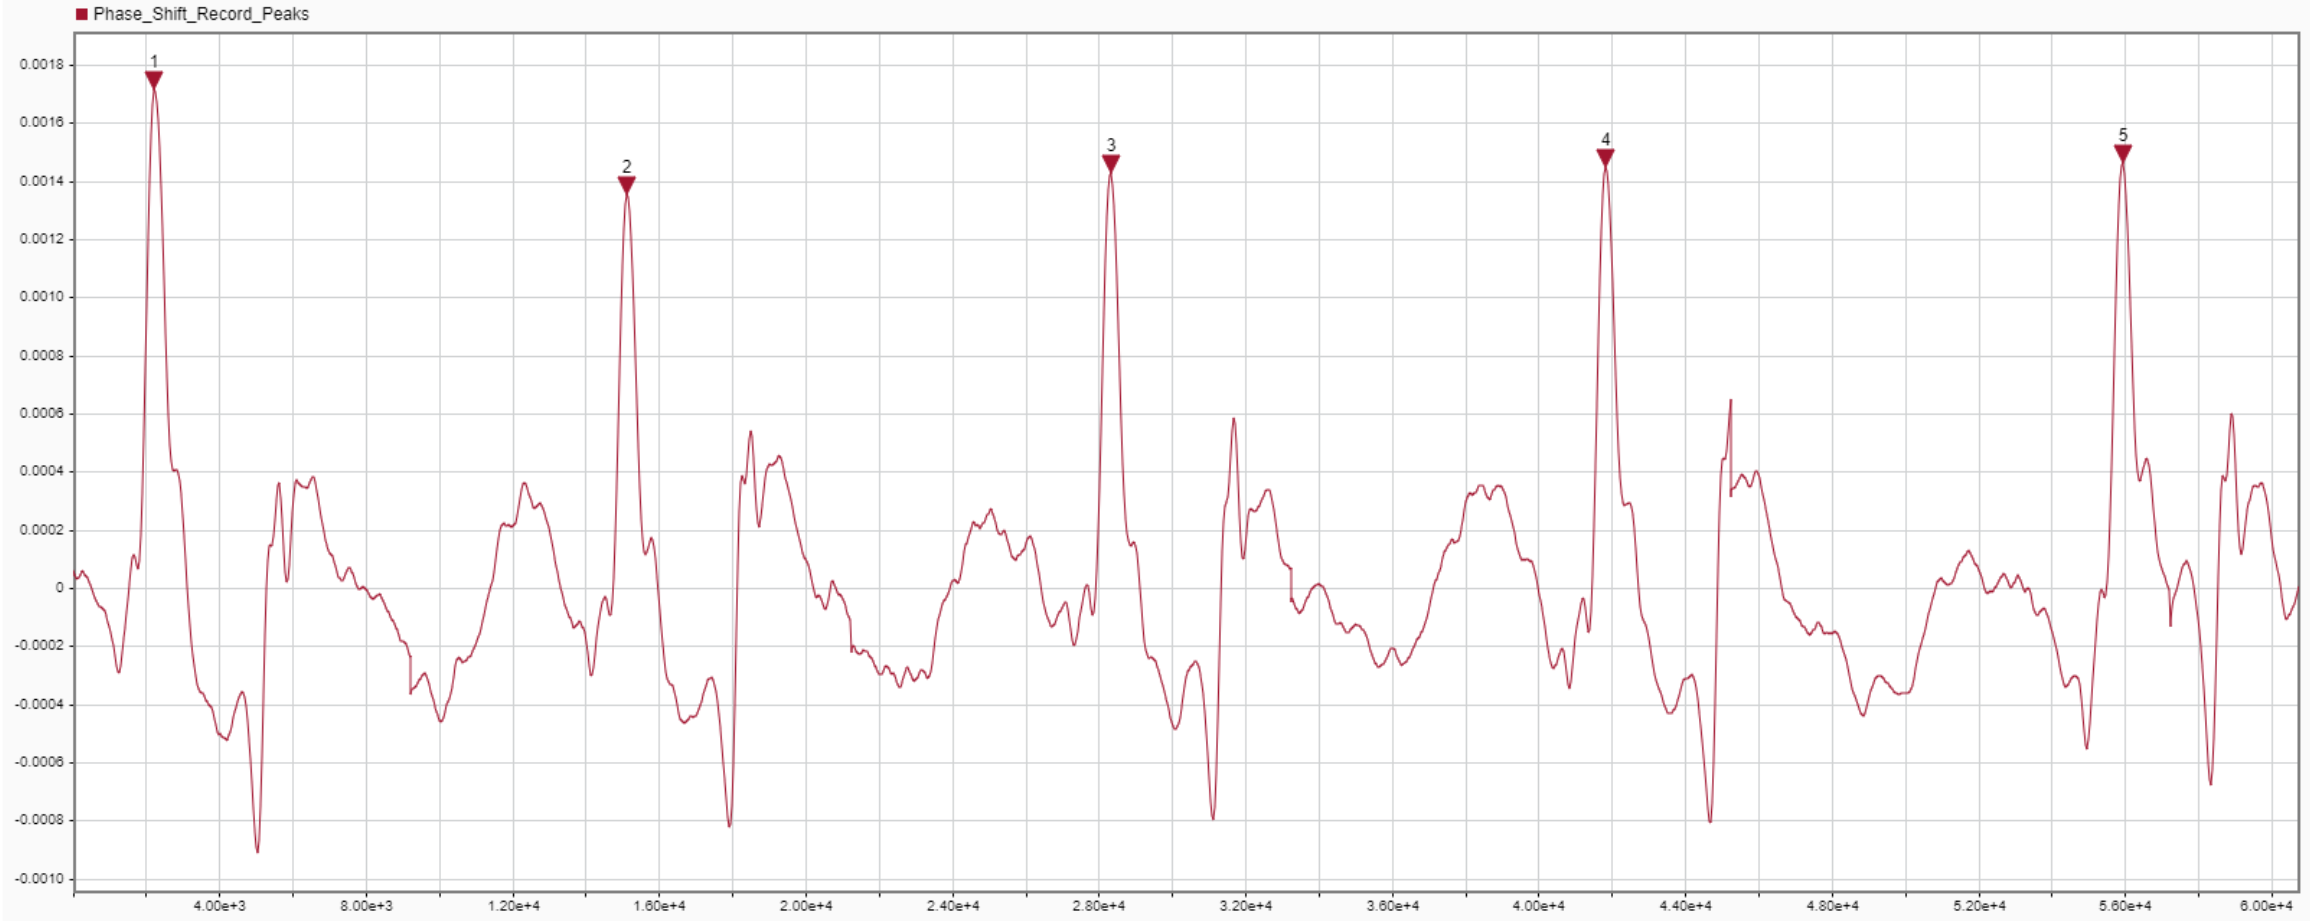
The human heart contracts to pump blood, creating a pressure wave that travels outward. This wave causes volume changes in the arteria carotis communis, leading to its expansion and resulting in a detectable frequency shift. These frequency shift peaks are clearly visible in the dataset shown in the figure above, labeled 1 to 5, representing five heartbeats. The quantity and timing of these peaks perfectly correspond to the acoustic signal of a pulse oximeter, confirming the effectiveness of the heartbeat measurement system.
Results of the first reengineered prototype based on the improvements done by Mr. Anderle and Mr. Tenta (2023)
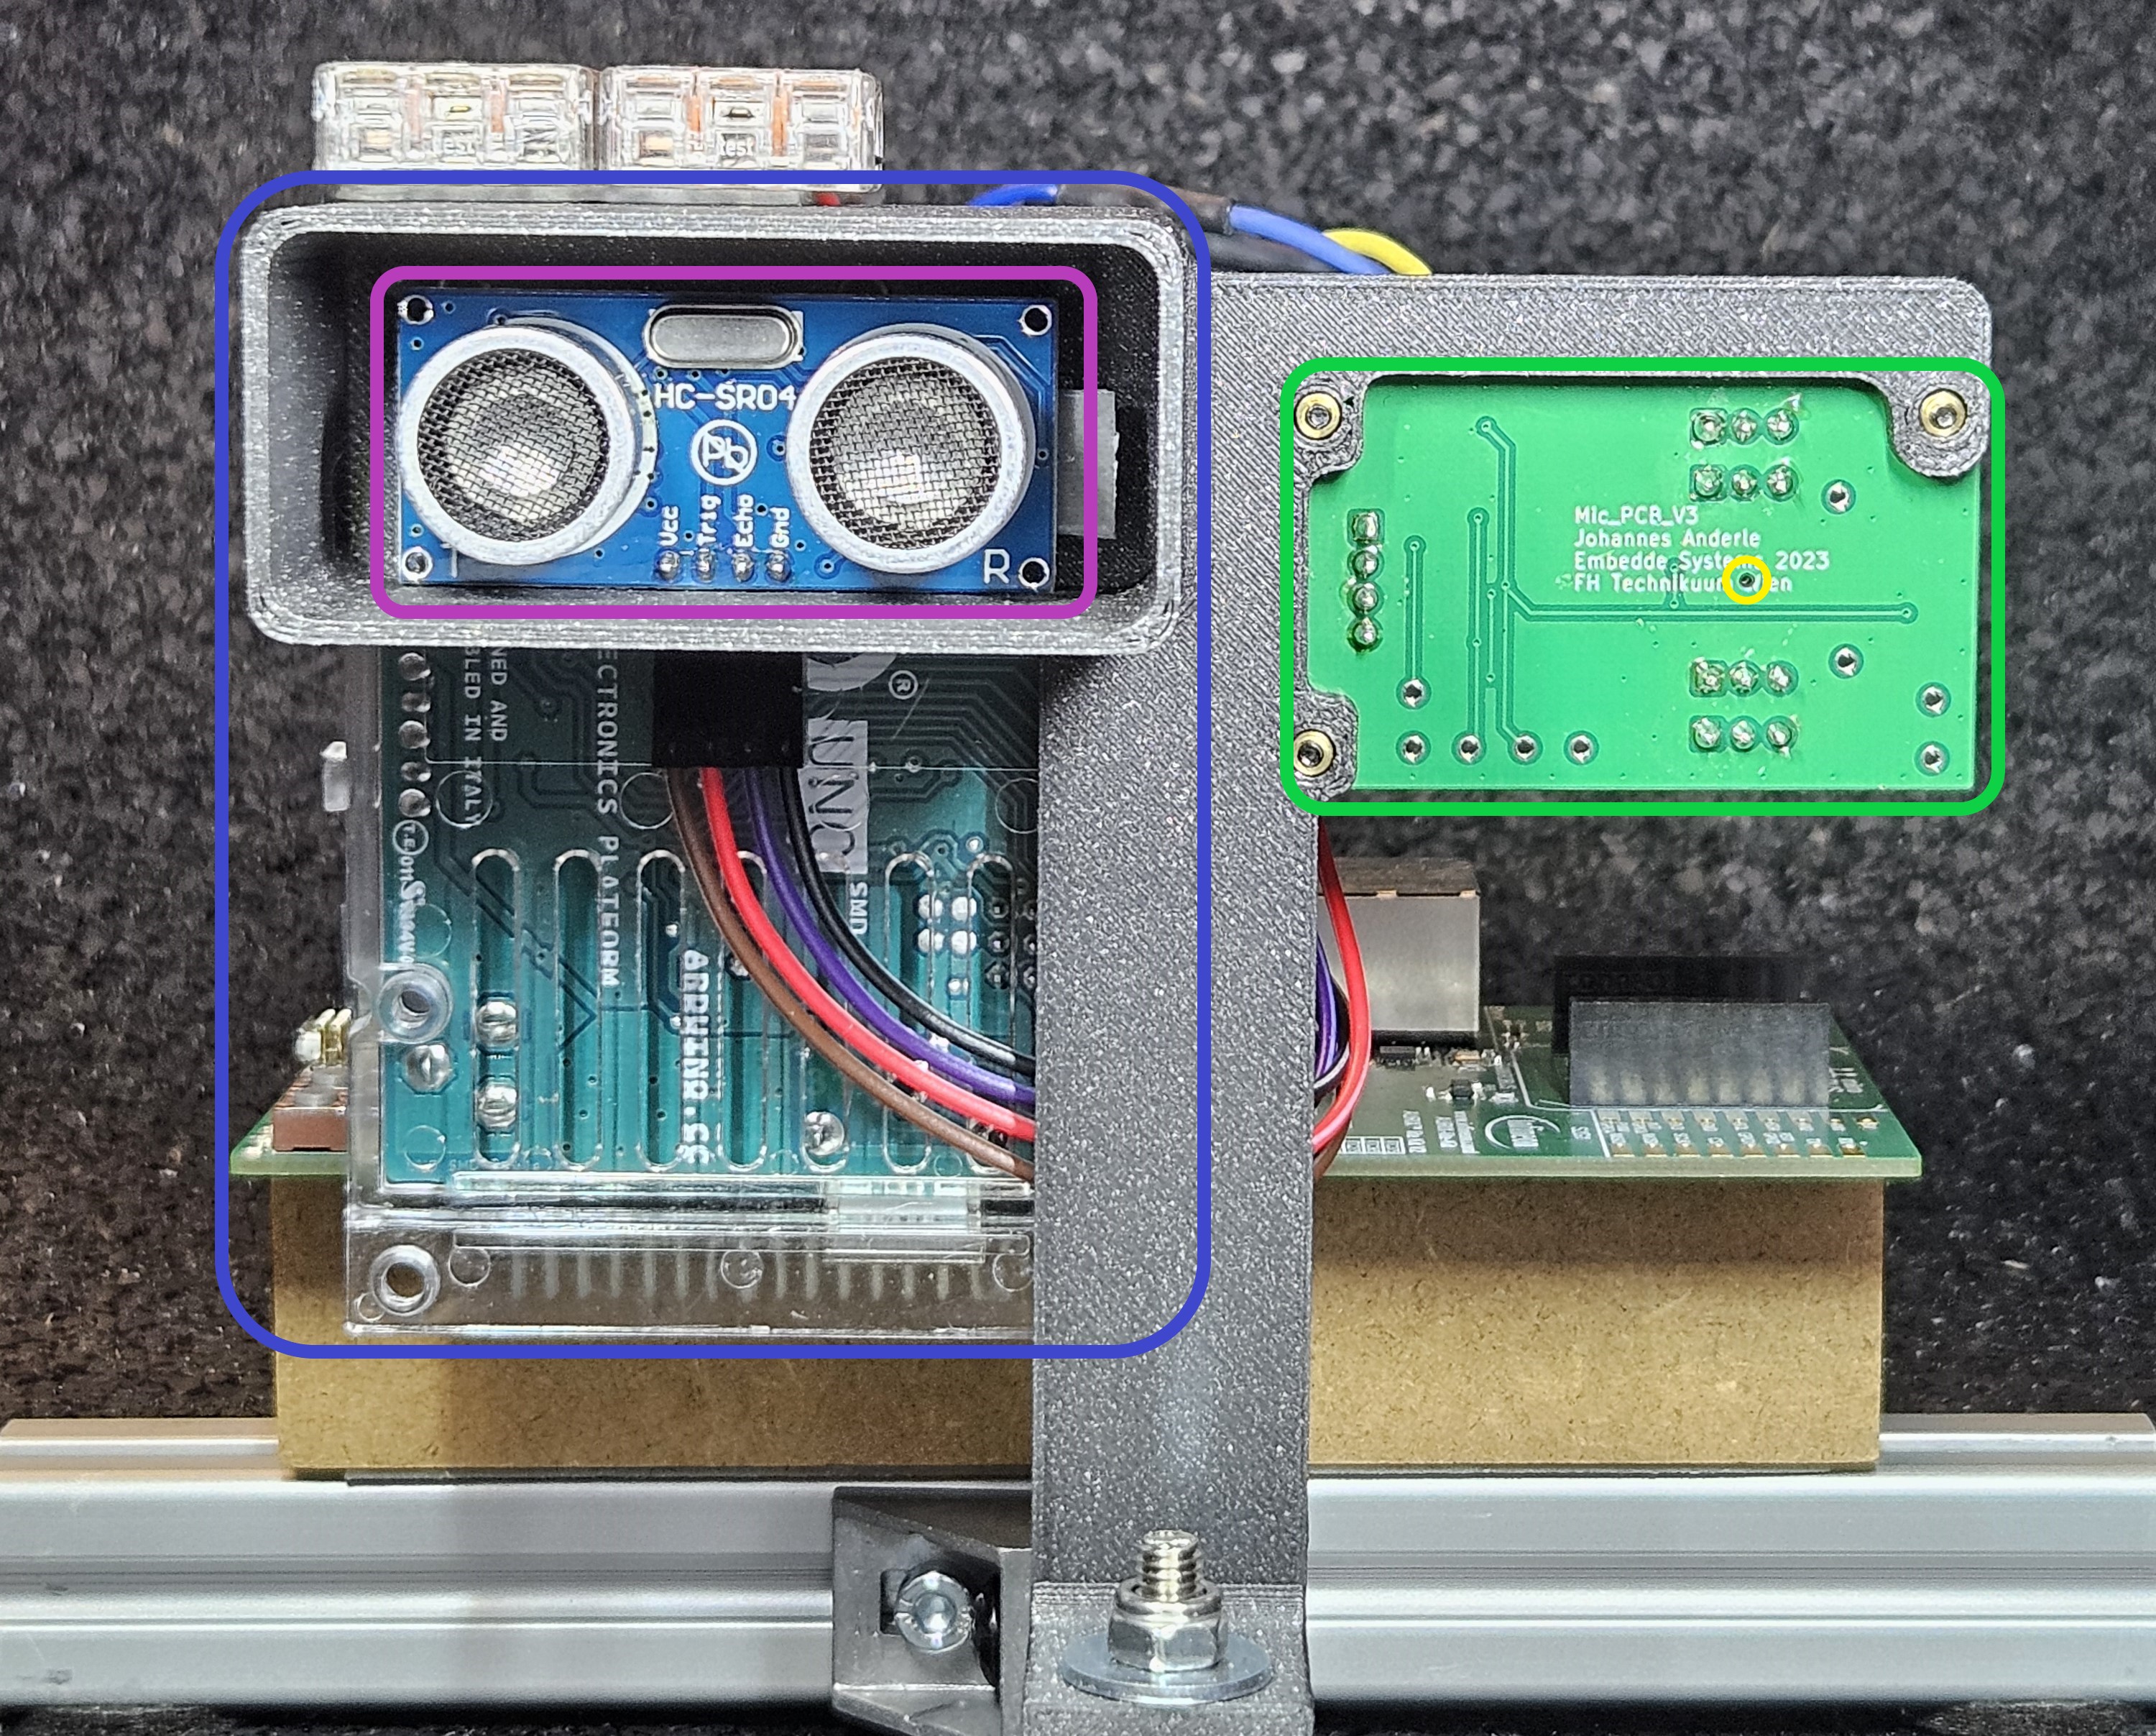
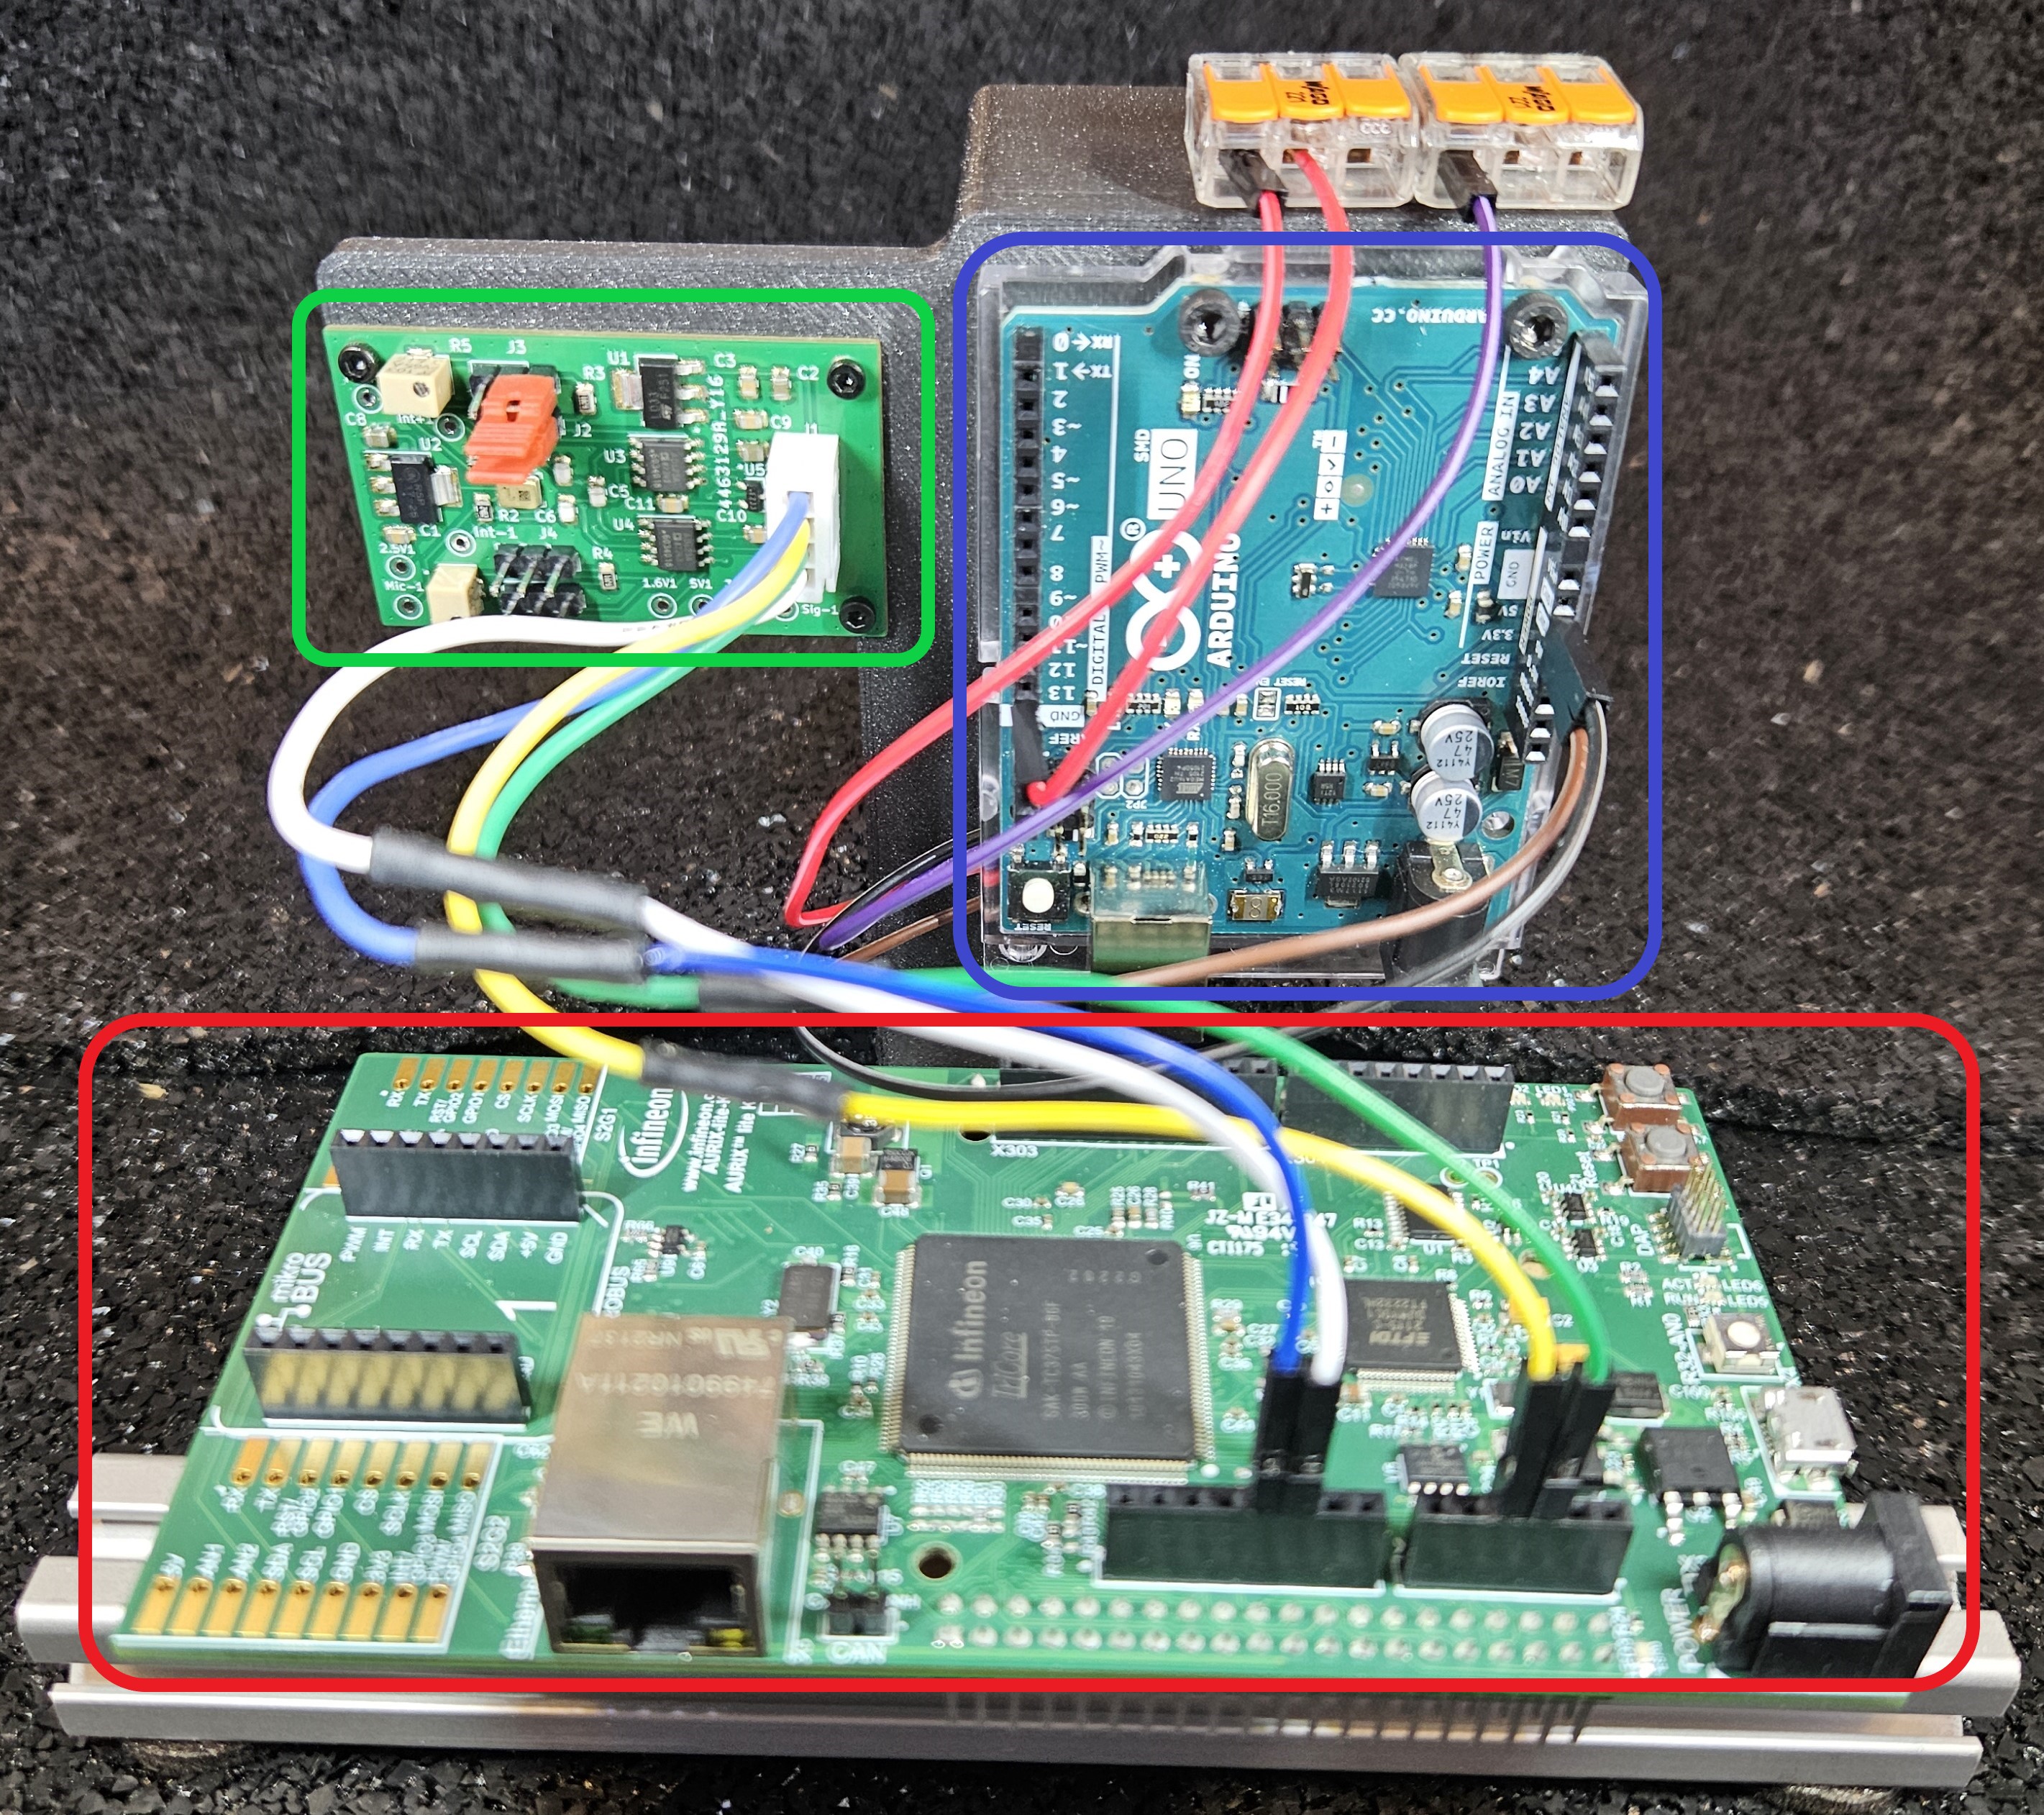
The prototype consists of three different units. For easy identification, the modules are color-coded - as seen in the figure below. The transmitter unit consists of an Arduino UNO R3, marked in blue, and an HC-SR04 ultrasonic ranging module, marked in purple. The Arduino is used here to supply power and trigger the ranging module, generating a trigger pulse every 100 milliseconds. Eight 40kHz pulses are emitted with each trigger to determine the distance. The echo is recorded and amplified at the audio front end, marked in green. In the following figure, the sound input of the microphone is marked yellow. The amplified signal is then sent to the processing unit, the Aurix LiteKit, marked in red.
Sinus signal Test
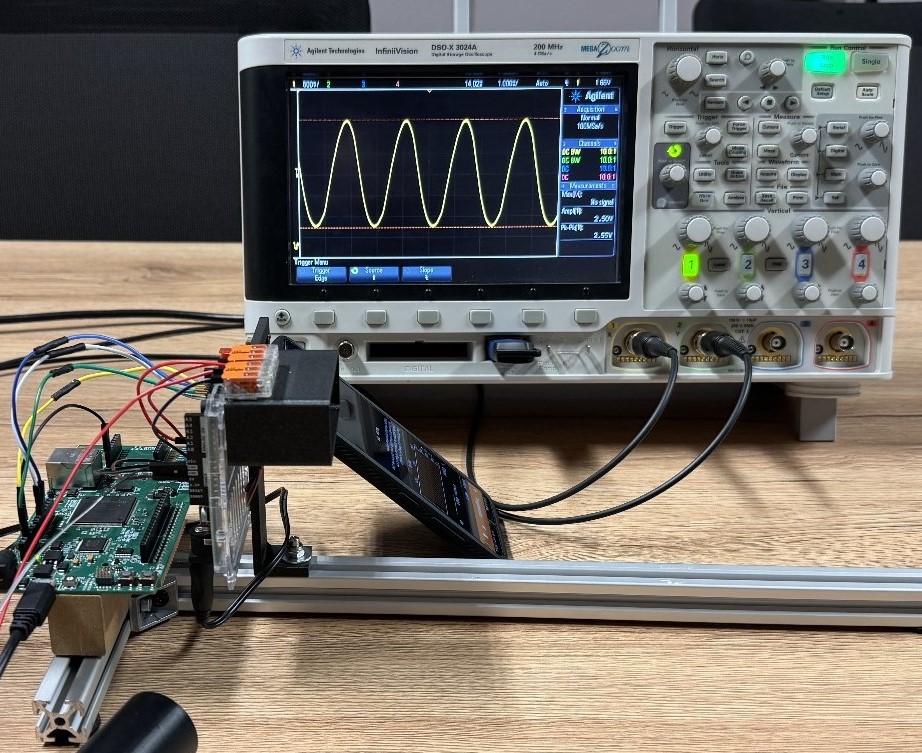
The objective of the initial performance test is to check the correct functioning of the newly developed part of the signal chain. A sine wave of 440 Hz is played into the microphone. The sound source used was the sound generator of the phyphox app on a Samsung Galaxy S23 smartphone. The output signal of the audio front end is shown on the oscilloscope in the figure below. This test concluded that all components performed as expected.
Ultrasound ranging
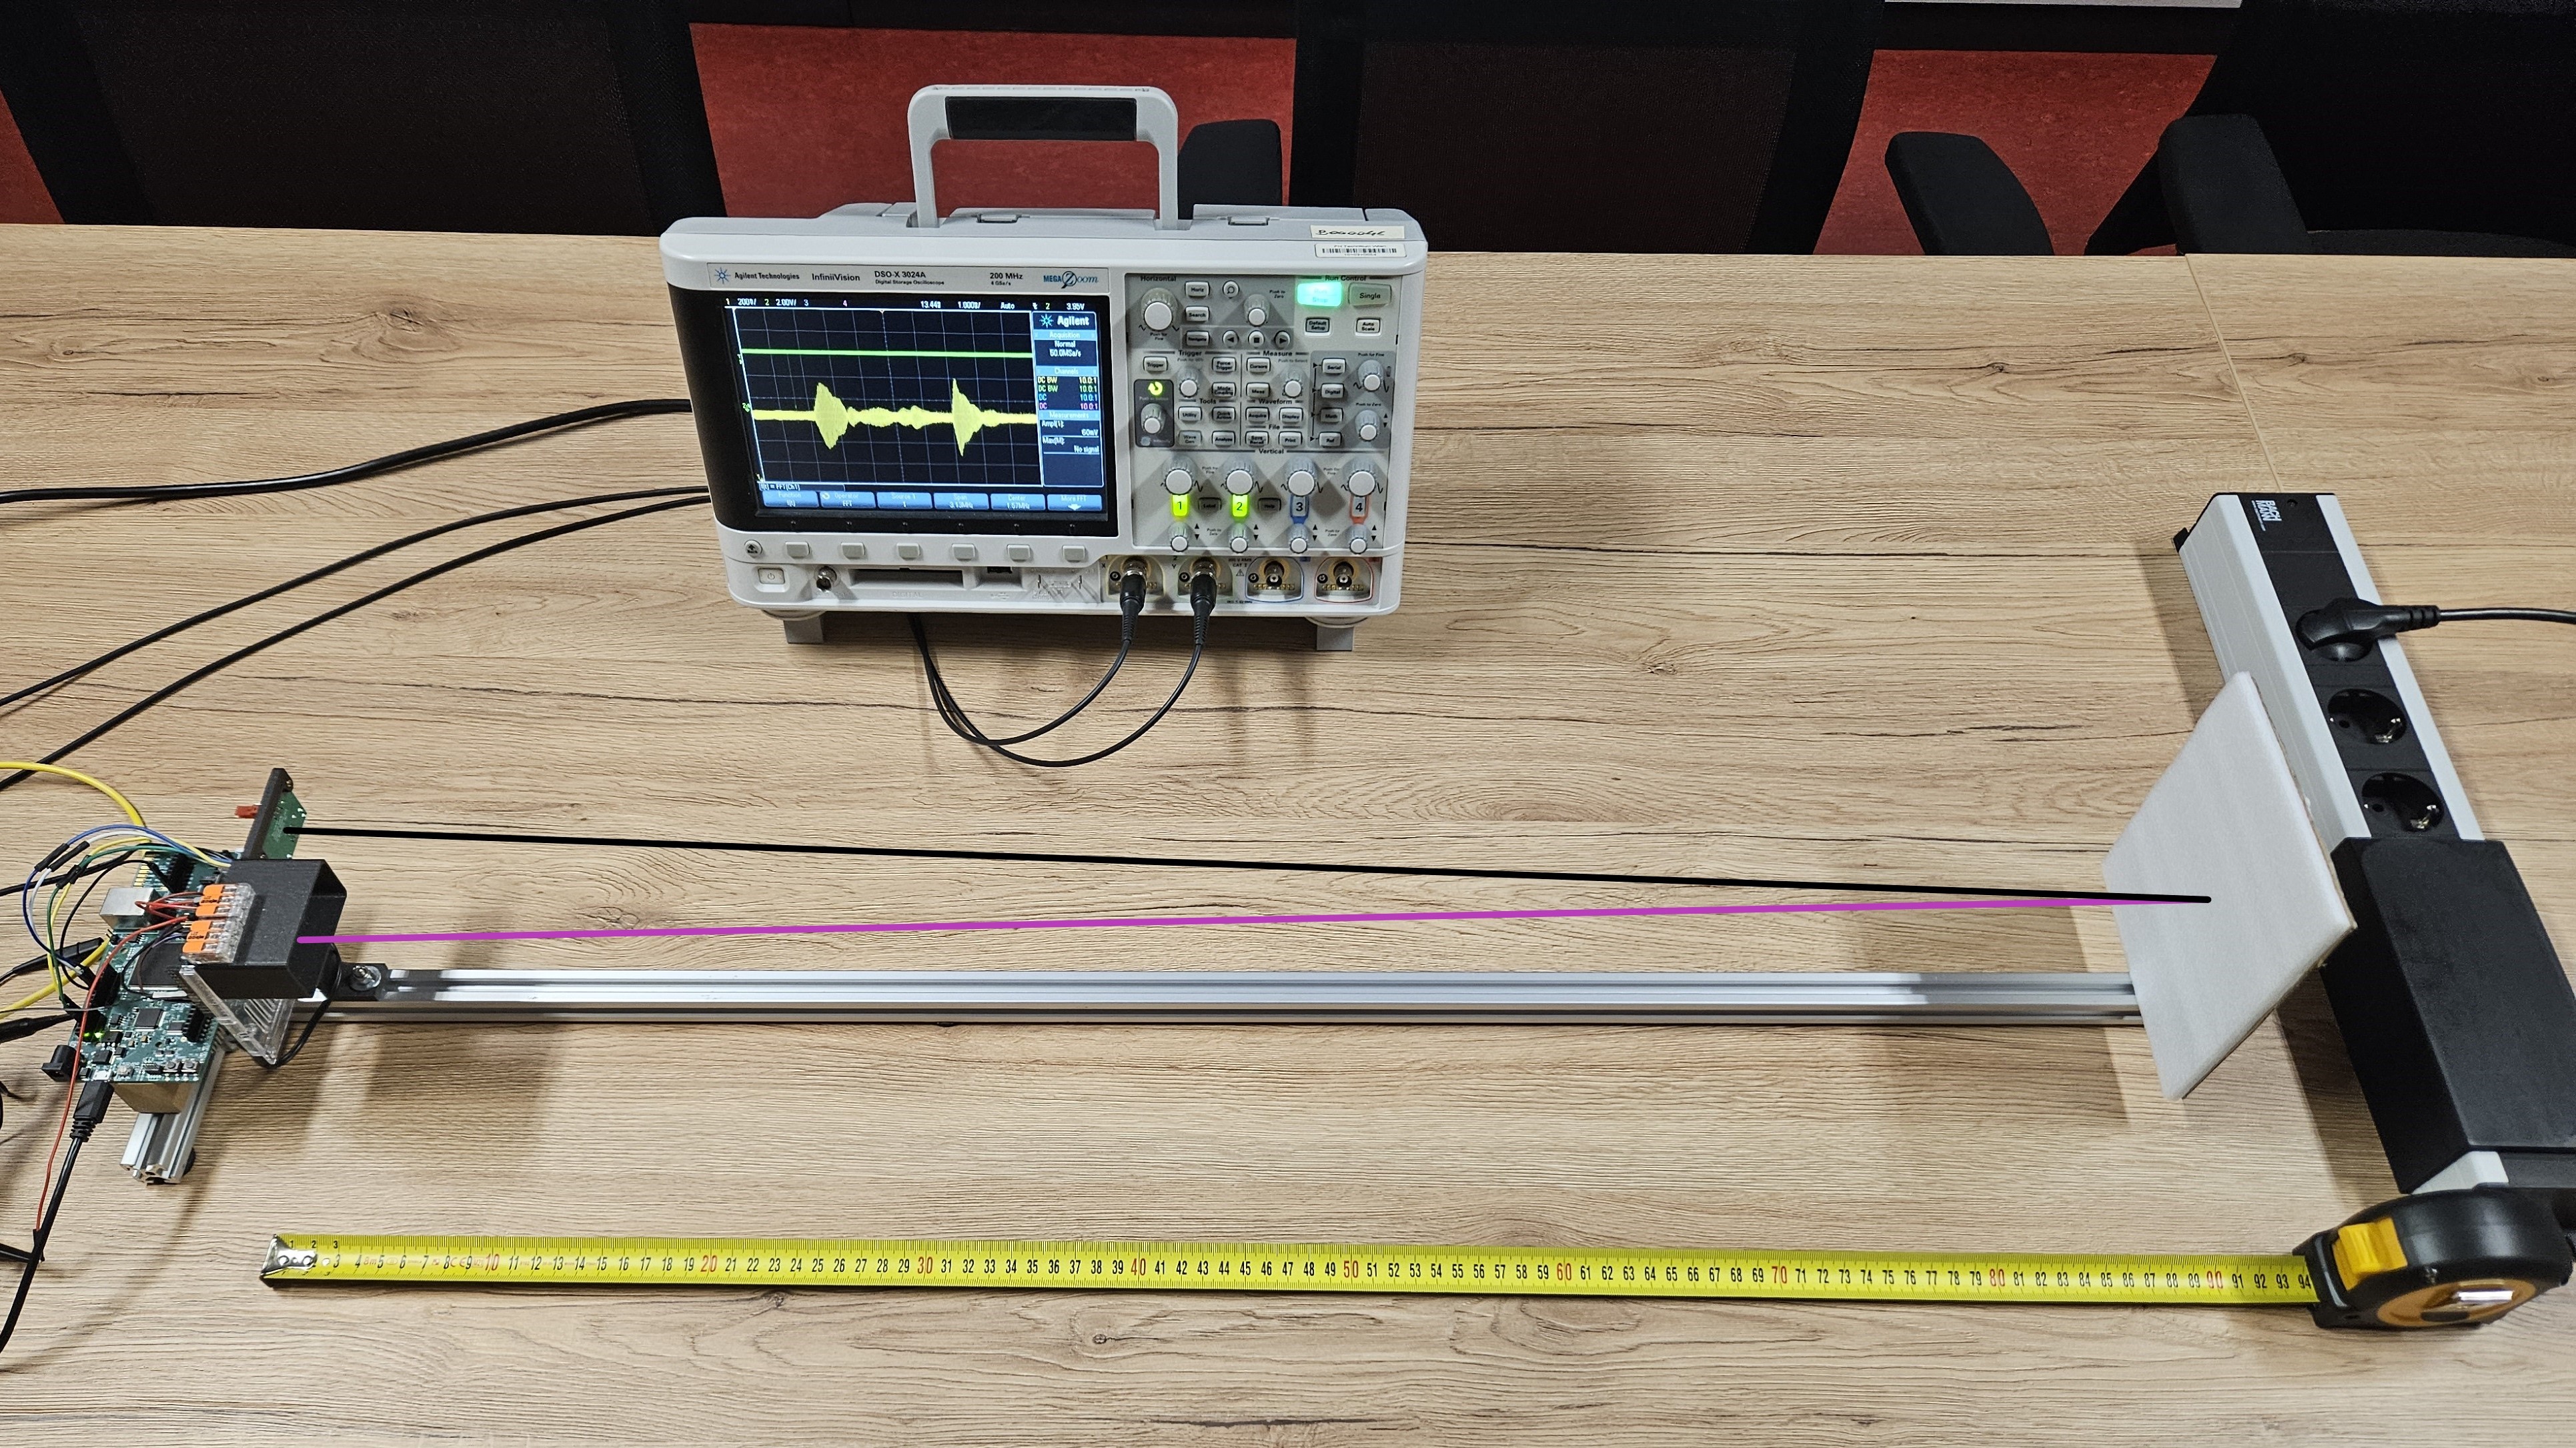
In this test, the ultrasonic module is used as the signal source. The microphone picks up the echo of the ultrasonic pulse generated by an obstacle. The time delay between transmission and reception is used to calculate the distance. The figure below shows the entire experiment setup. The obstacle is 85cm away from the microphone. The path of the ultrasound is shown in purple and the echo reflection in black. The figure below that shows the oscilloscope screen currently measuring the amplified signal. The trigger pulse of the Arduino is circled in green. The red line marks the transmission time of the ultrasonic pulse. The purple circled signal is the recording of the transmitted signal, which can be ignored. The blue line, circled in black, marks the time of echo reception. The yellow line represents the transit time of the signal. It has a length of about 5 units. One unit corresponds to 1mS.
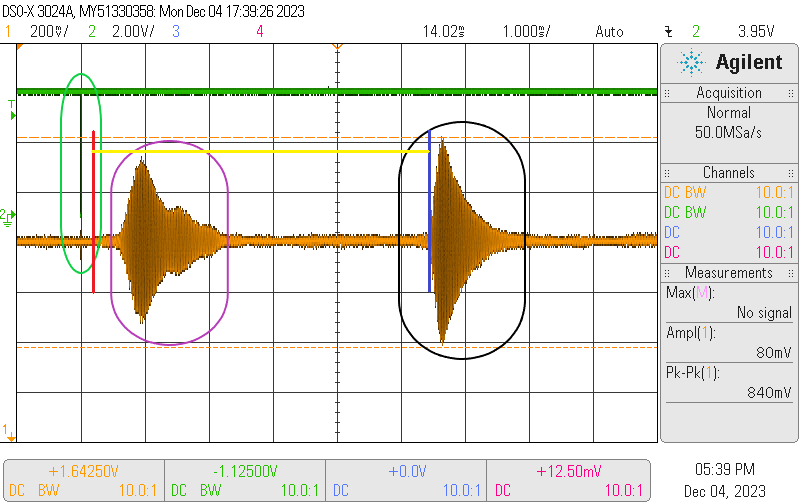
At a speed of sound of 340m/s, this equates to a measured distance of 170cm. This length matches the double distance of 85cm accurately. This result proves the general functionality of the setup.
Evaluation of Operation Amplifier AD623 for Microphone Amplification by Mr. Anderle (2023)
The purpose of the Operational Amplifier (OpAmp) is to amplify the signals from the IM73A135V01 microphone so that the Aurix Litekit TC375 Analog to Digital Converter (ADC) inputs can directly process the data. The microphone provides a differential output with a DC Offset of 1.35V. This signal shall be processed to fit the 0V to 3.3V input range of ADC. This means the DC output offset of the OpAmp shall be at 1.6V, and the swing of the signal should be as close to ±1.5V, but must not exceed 0V and 3.3V respectively, otherwise, the ADCs could be damaged. According to the datasheet, the OpAmp AD623ARZ from Analog Devices meets all requirements. To verify the suitability and determine the optimal gain setting, a range of measurements have been conducted.
Measurement Setup
Due to the lack of an Anechoic chamber and to eliminate all other environmental factors, the microphone is replaced by a signal generator, which supplies a differential sinusoid signal, Input Signal A (InA) and Input Signal B (InB). Two OpAmp are connected to the signal generator: OpAmp A is fed the unaltered differential signal and has a fixed gain, OpAmp B receives the inverted differential signal and has a variable gain set by a potentiometer.
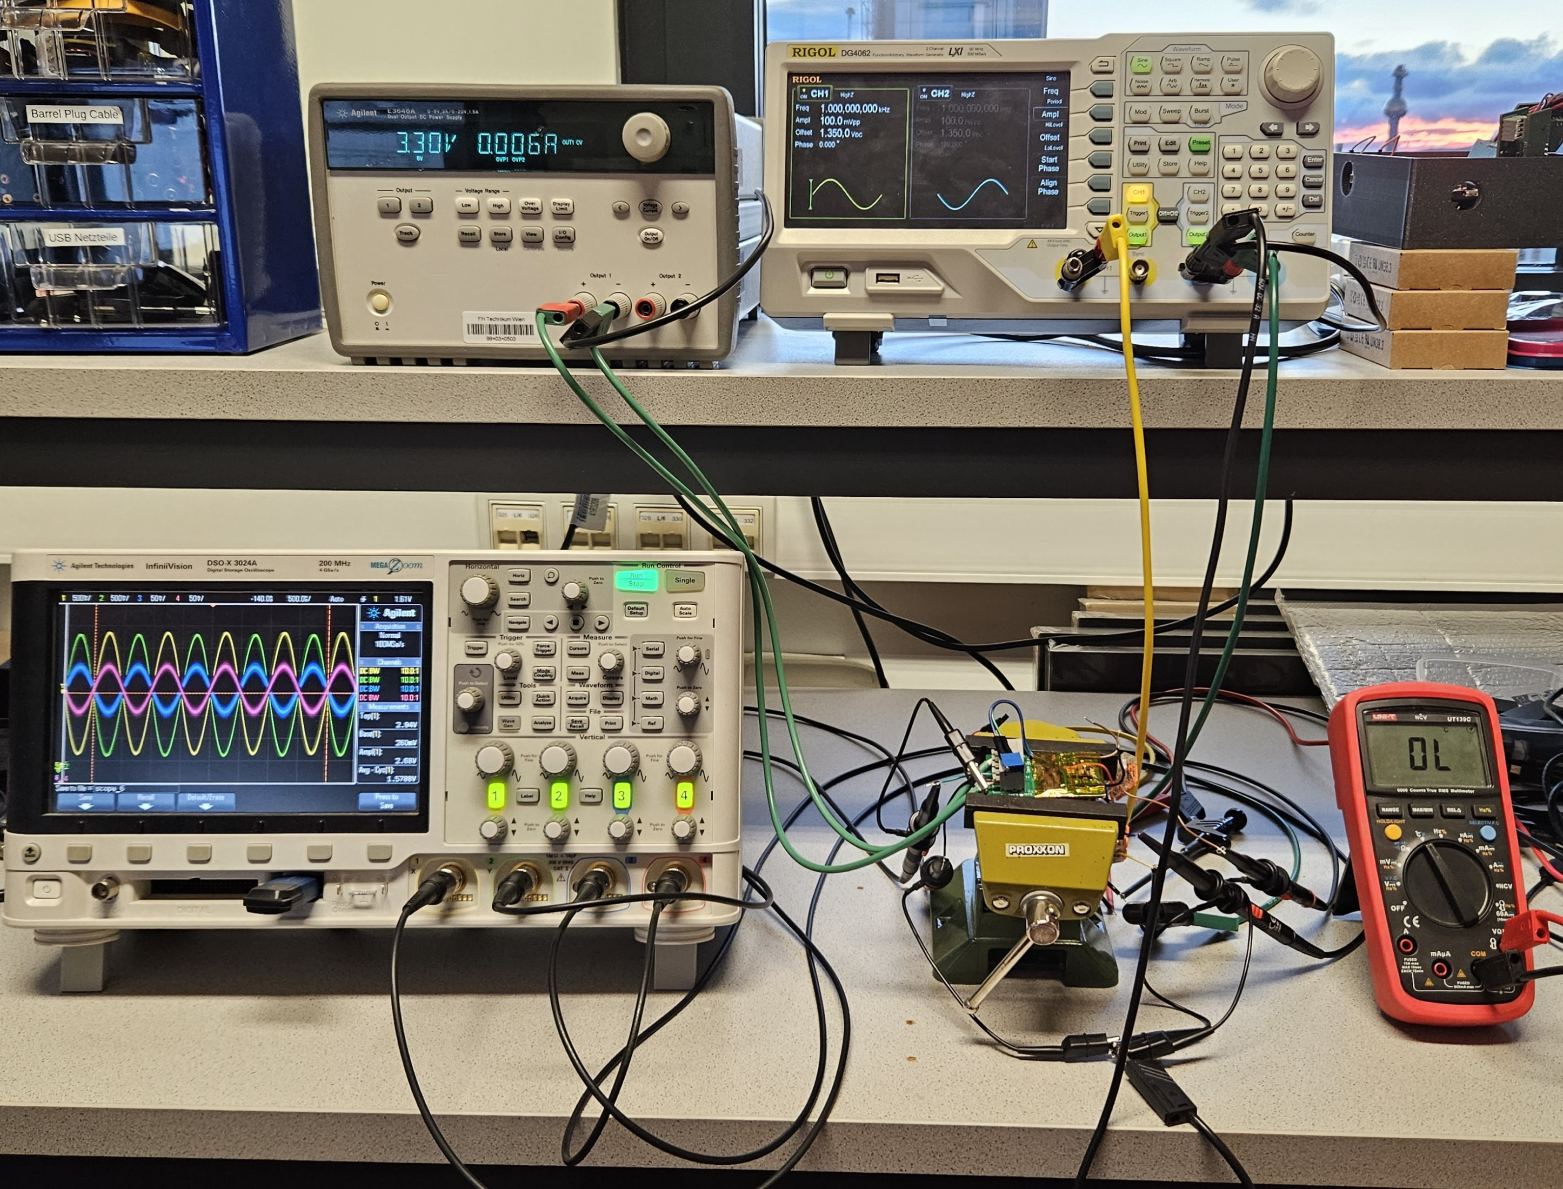
Testing process
The supply voltage of both OP-amps is 3.3V, and the Output DC Offset (OutOff) is 1.6V. The differential signal InA and InB are two sinewaves with the same amplitudes, frequency, and Input DC Offset (InOff) but a 180° phaseshift. The gain of OpAmp A is fixed with an 8.2kOhm resistor to 13.2. In each following oscilloscope graph, there are 2 to 4 signals, which are read as follows:
• PinkInput Signal A (InA)-> Differential Input generated by signal generator
• BlueInput Signal B (InB)-> Inverted Differential Input generated by signal generator
• YellowOutput Signal A (OutA)-> Output Signal of OpAmp A
• GreenOutput Signal B (OutB)-> Output Signal of OpAmp B
If not noted otherwise, the gain mentioned in each caption is always gain B.
Baseline Test
Measurement OpAmp behaviour with and without InOff with different Peak to Peak Voltage (VPP) and low frequency.
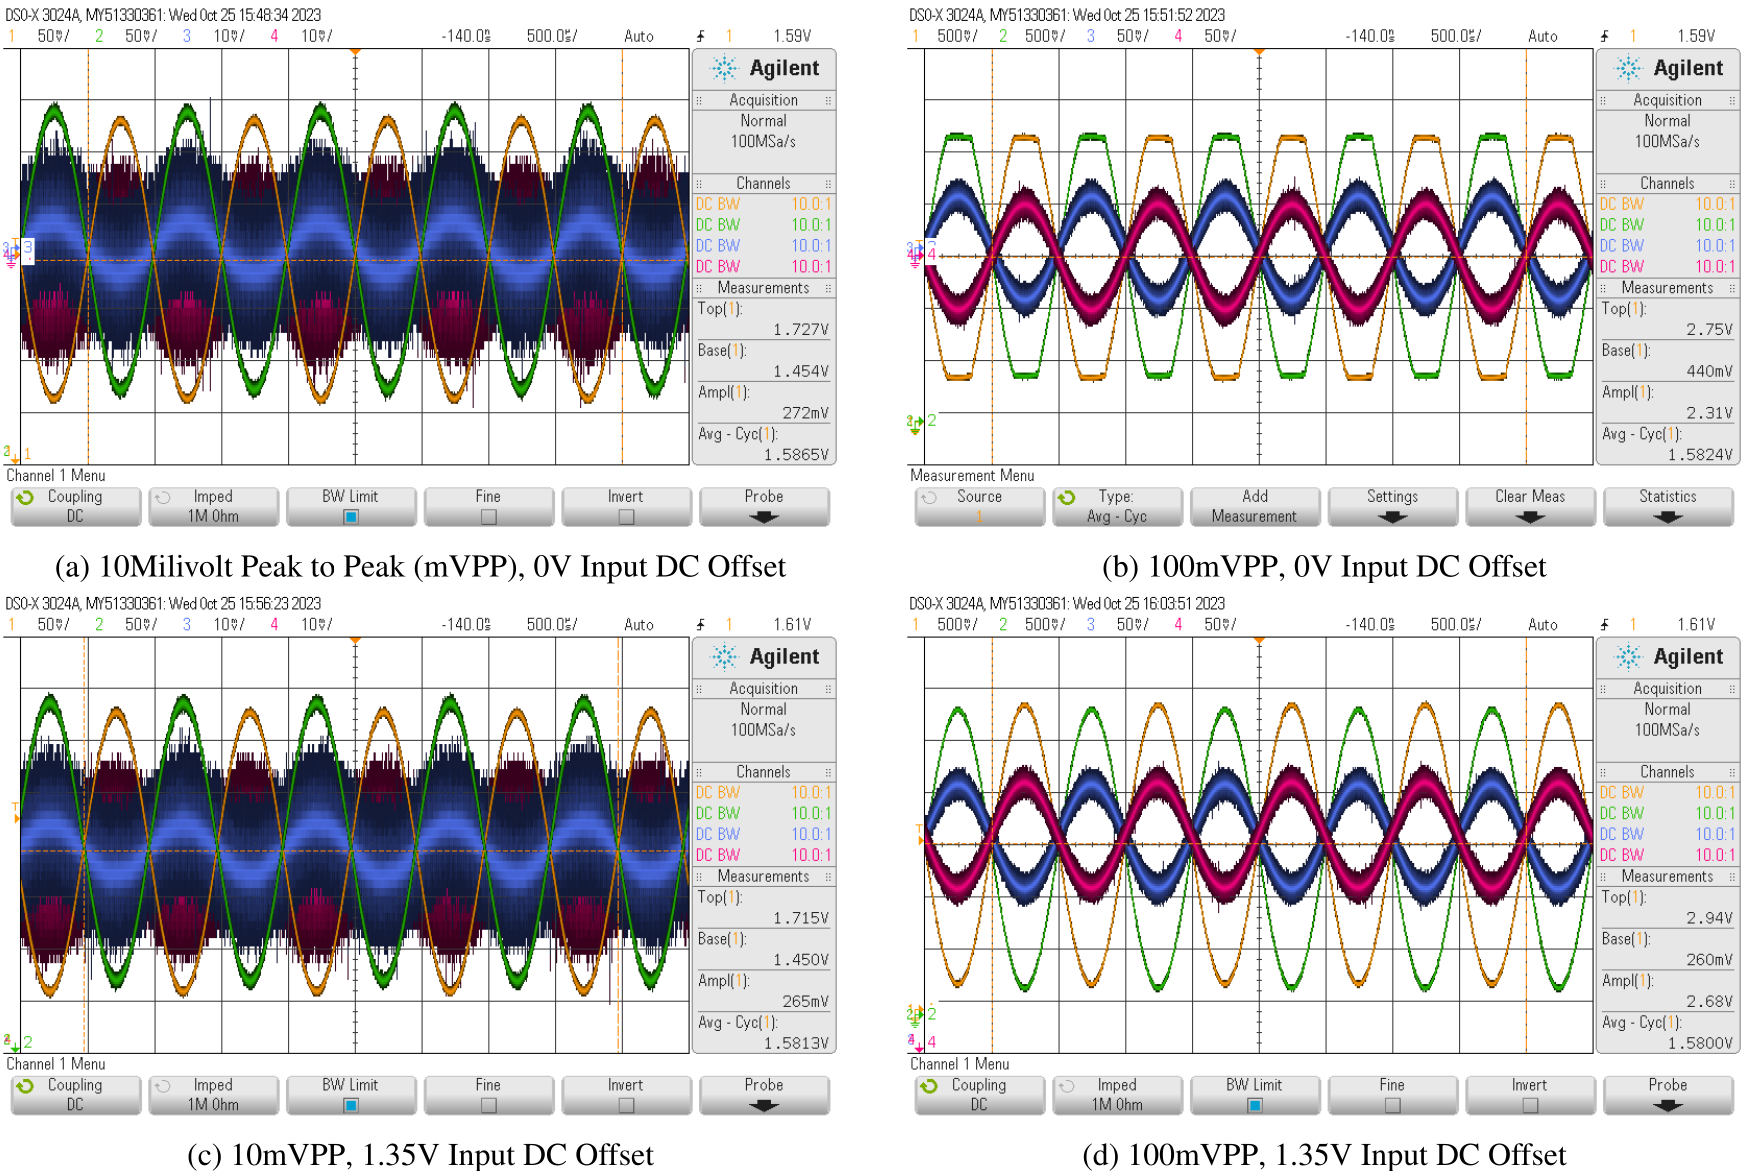
The OpAmp is not able to produce a wide enough amplitude on the output signals to satisfy the requirements, only 2.31V instead of the desired 3V. This behaviour is in line with the datasheet. With an InOff, the desired amplitudes are achieved.
Higher Frequency Test
In this research project, 40kHz signals shall be measured, therefore, the Baseline Test is repeated but with a higher frequency. To leave a bit of headroom, the evaluation is done at 42kHz.
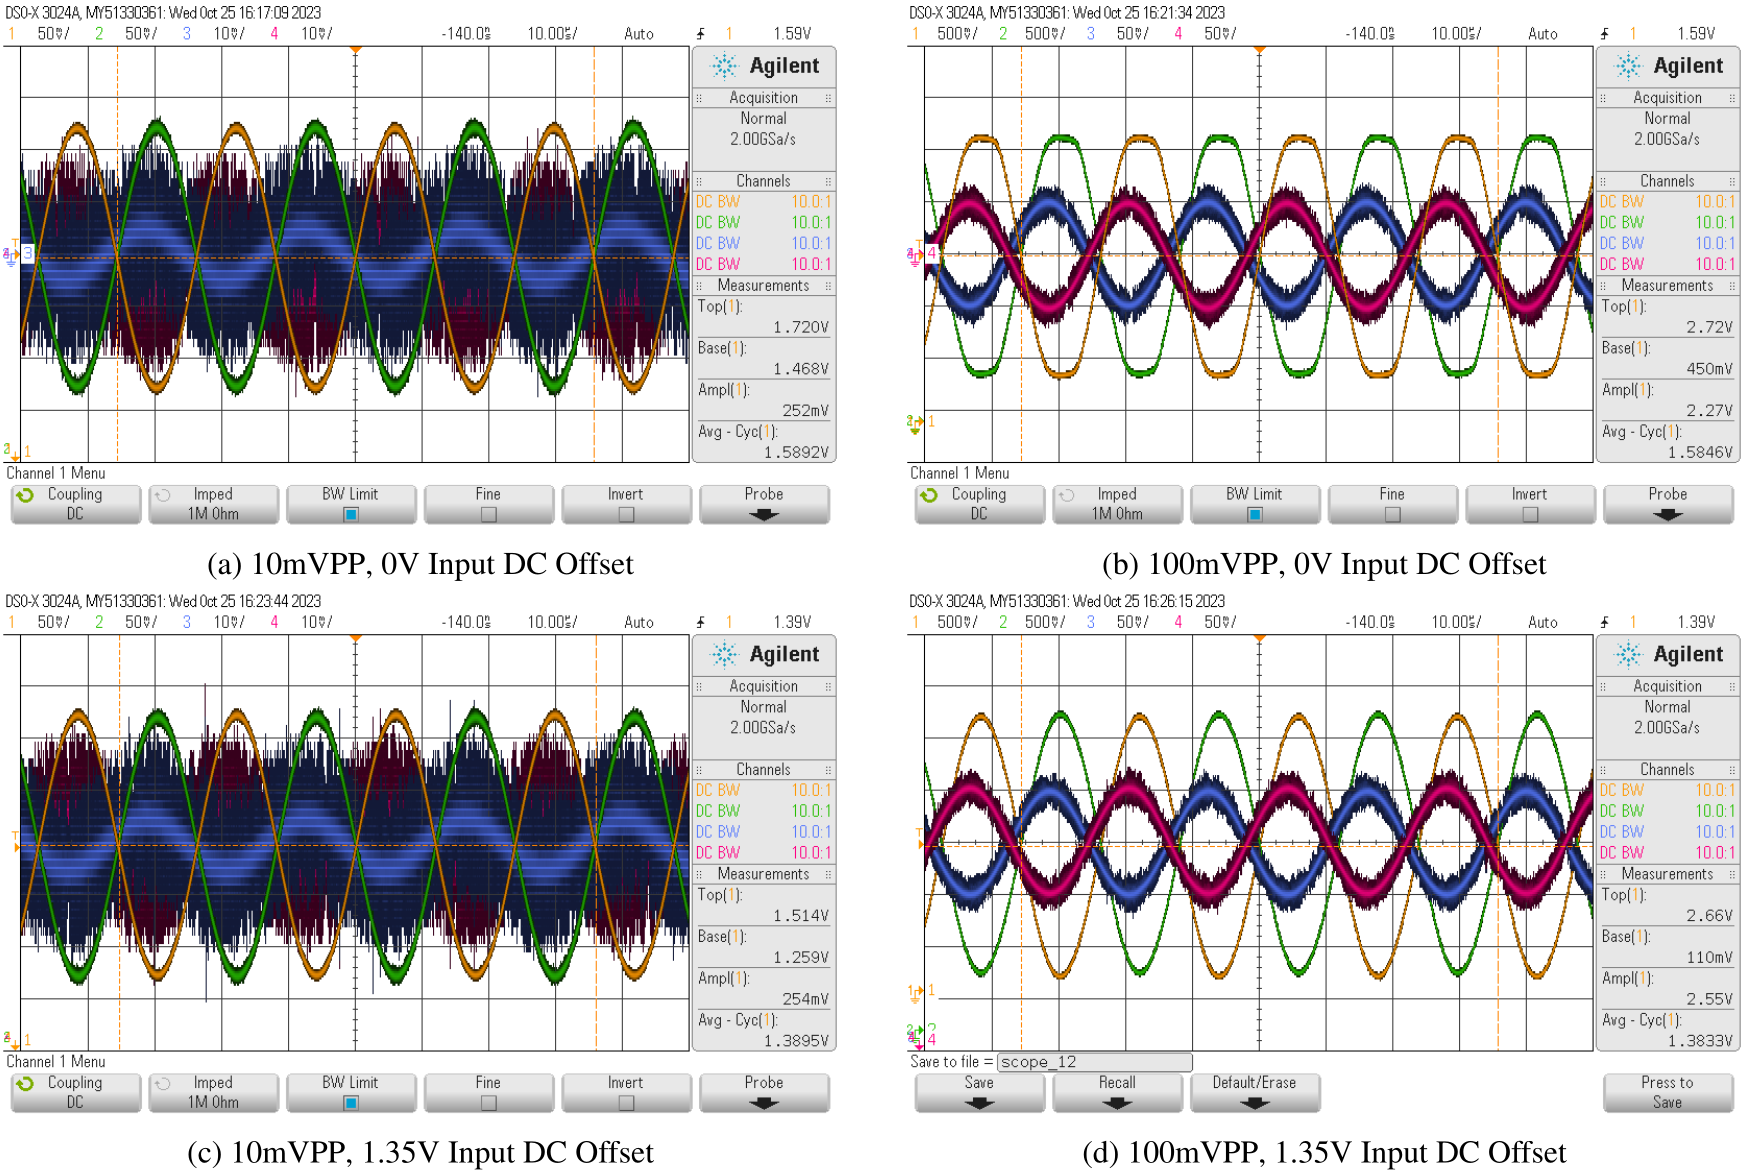
The overall results are similar to the of Baseline Test, but with a key difference. The amplitude of the output signals InOff is lower. This indicates that the OpAmp is near its maximum capability. The phase shift from input and output signals is also noteworthy. This shows that the amplification of an OpAmp is not instant and introduces delay. This delay is neglectable for our purpose. The figures below indicate an OutOff of only 1.39V. This is a measurement artefact; the actual OutOff is close to 1.6V.
Gain Adjustment
To compensate for the amplitude reduction in Higher Frequency Test, the gain needs adjustment. This is achieved by altering the gain resistor. Until now, the Resistor from OpAmp B was fixed to 8.2kΩ. This resistor is replaced with a potentiometer. To explore a suitable gain experimentally the potentiometer value is decreased, and therefore, the gain increases. For the following measurements, it is important to keep in mind that only the OutB (green line) changes, the OutA (yellow line) is present only for reference.
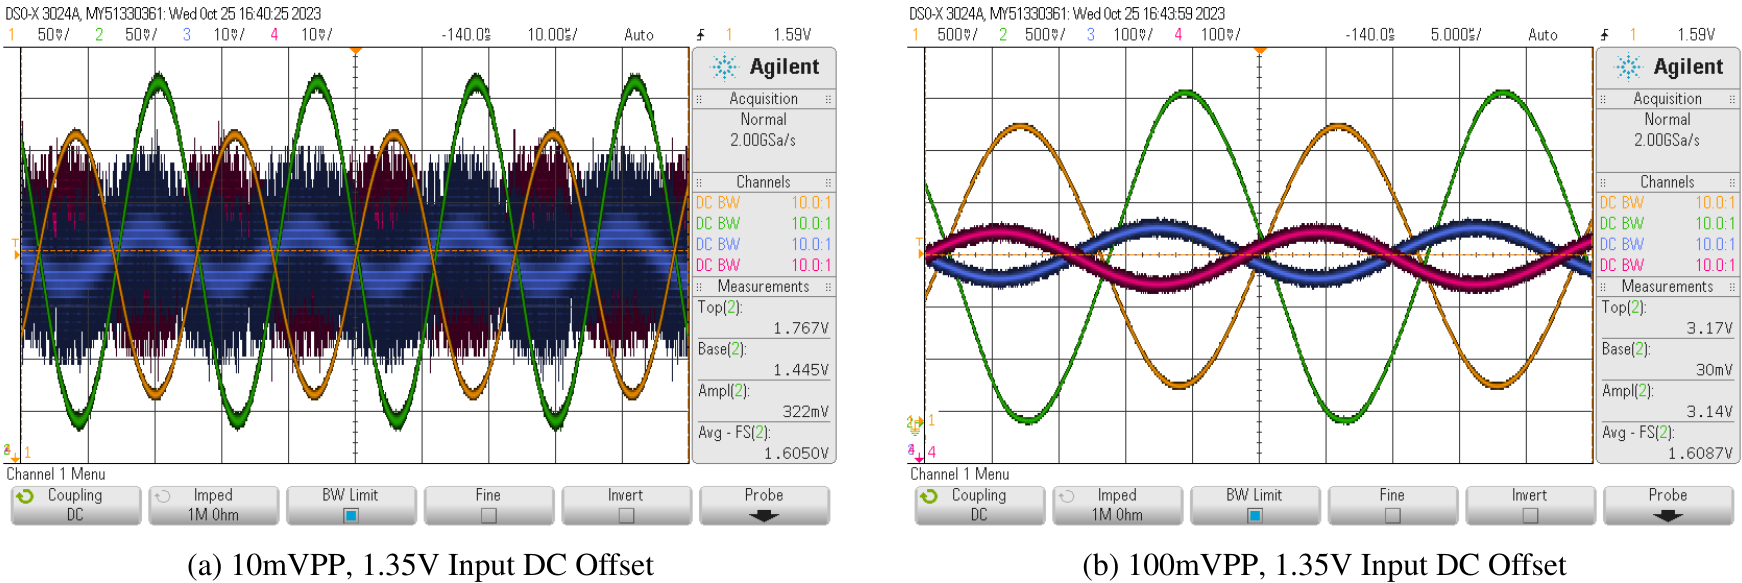
At a gain of 17.67, as shown in the left figure above, the OutOff is still at 1.6V. In the right figure above the OutB covers nearly the whole desired range without clipping. This confirms that a gain value of 17.67 is ideal for an input signal of 100mVPP.
Gain Optimization
The gain of 17.67 is ideal but requires a resistor of exactly 6kΩ, which is not a common value and, therefore, harder to obtain and more expensive. A more available option is the resistor value of 6.2kΩ, which results in a gain of 17.2. As shown in the figure below, this resistor reduces the amplitude of OutB to 3V. With an OutOff of 1.6V, this leads to a range of 0.1V to 3.1V. This leaves some headroom, and the input swing of +-1.5V makes the signal processing more convenient.
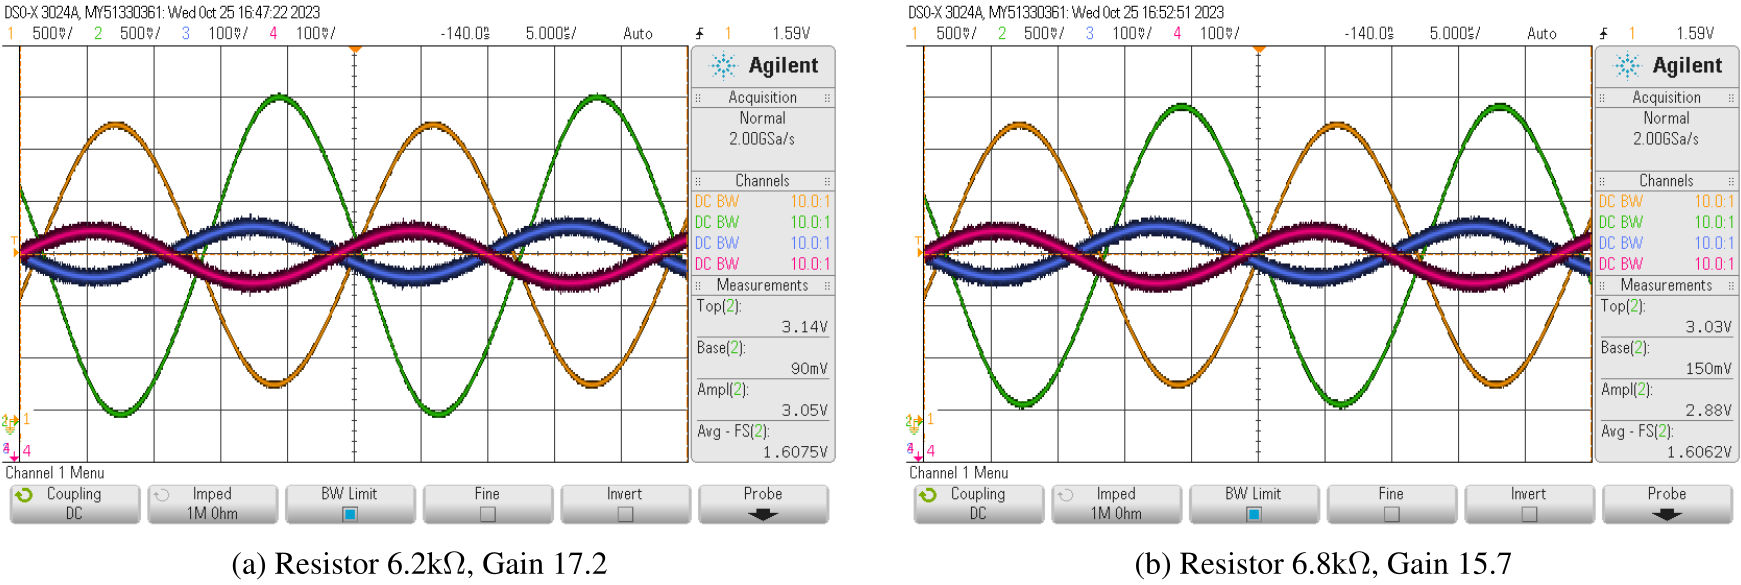
The use of a very common 6.8kΩ resistor is suboptimal, but as shown in 5b, it still has a wider output range than the previously used 8.2kΩ resistor in Baseline Test.
Limit testing
As the ideal and optimal gain are determined, knowing the maximum possible gain without artefacts or distortion may be useful in further research. These values are also obtained by changing the resistor value of the potentiometer. For the following measurements, the input signals are hidden, but the parameters are: Frequency of 42kHz, a DC offset of 1.35V, and an Amplitude of 10mVPP to prevent clipping in the OutB.
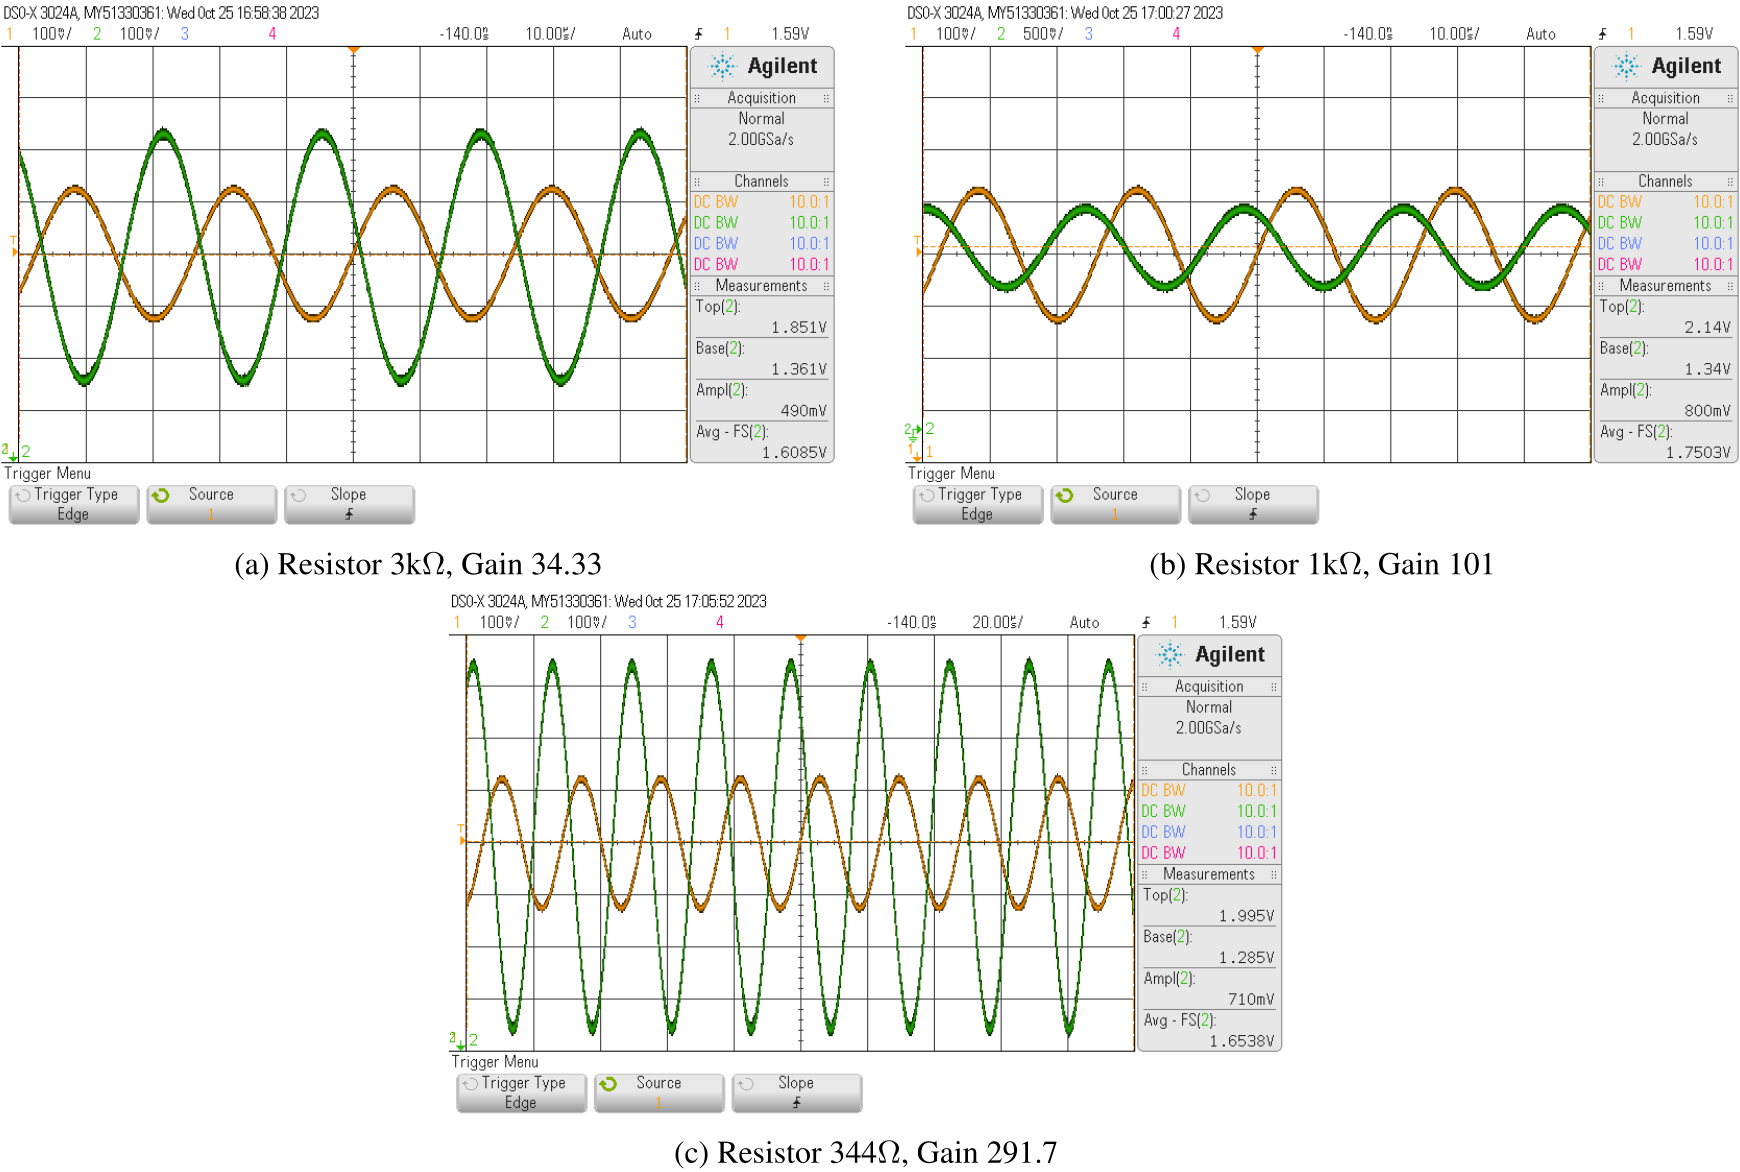
At a gain of 34.33, shown in the top left figure above, the OutOff starts to rise, and the phase shift increases. The gain of 101, initially chosen for the first microphone test circuit, elevates the OutOff by 0.15V, the phase shift is further increased, and small artefacts can be seen in the top right figure above. The last stable point in this setup is a gain value slightly under 300. At this point, the output offset jumps erratically, and the waveform has noticeable artefacts. In the bottem figure above, a very clean shot of the barely stable OutB is shown. A gain beyond 300 results in random output and is no longer usable.
Results
The OpAmp AD623ARZ can process a differential signal with a Input DC Offset (InOff) of 1.35V and a Peak to Peak Voltage (VPP) of 100mV. If the input signals amplitude goes below 20mVPP, the OpAmp will reach its max capabilities. For the purpose of this research, the performance of the OpAmp AD623ARZ is sufficient.
Measurements Captured Using the Initial Hardware Implementation by Mr. Gneist (2022/23)
This section details the experimental setup and measurement conditions utilized in the project, building upon the foundational work conducted by Mr. Gneist in the 2022/23 academic year. The methodology and insights from Mr. Gneist's initial hardware implementation have significantly informed the approach and execution of the current measurement processes. The target system's operation necessitates a dual-connection setup: a USB connection for both power supply and debugging via UART, alongside an Ethernet connection for UDP data transfer of measurement values to a Matlab script. These essential connections are configured on the LiteKit evaluation board, serving as the backbone of our experimental framework. The positioning of the ultrasonic transmitter module at a height of 108cm establishes a reference point for the arrangement of the microphone modules, mirroring the elevation of the sound source to ensure consistent measurement conditions. The setup's orientation, with the sound source placed directly in front of the system's defined center unless noted otherwise, is crucial for the accuracy of our data collection, as visually represented in the upcomming figure. Furthermore, the ambient sound level within the measurement environment was carefully monitored, registering an average of 37dB(A) in its quiescent state. This measurement provides a baseline for evaluating the system's sensitivity and operational efficacy under controlled conditions. The figure below offers a visual overview of the measurement setup and environmental considerations, echoing the rigorous standards and meticulous planning characteristic of Mr. Gneist's preliminary investigations.
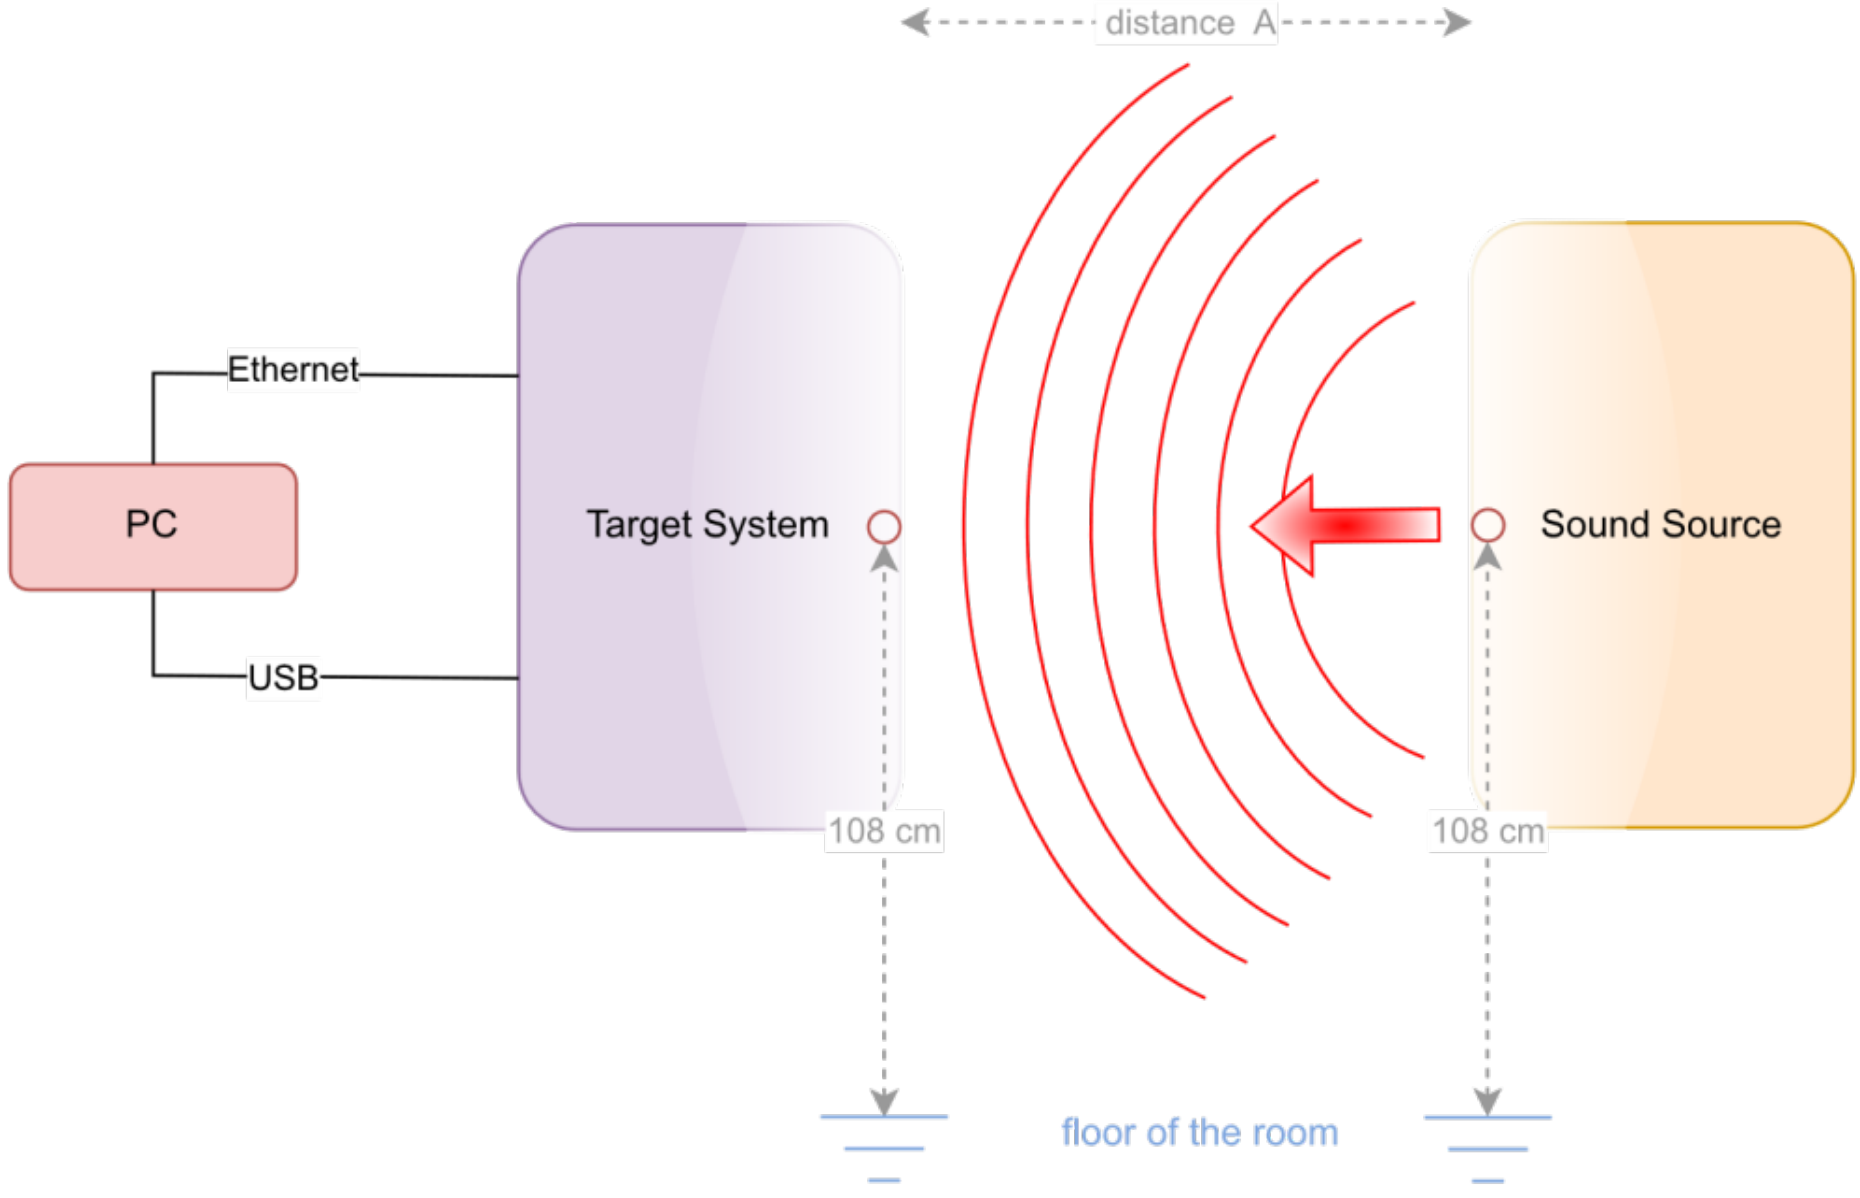
Assessment of Microphone Modules’ Noise Floor and Ambient Room Noise
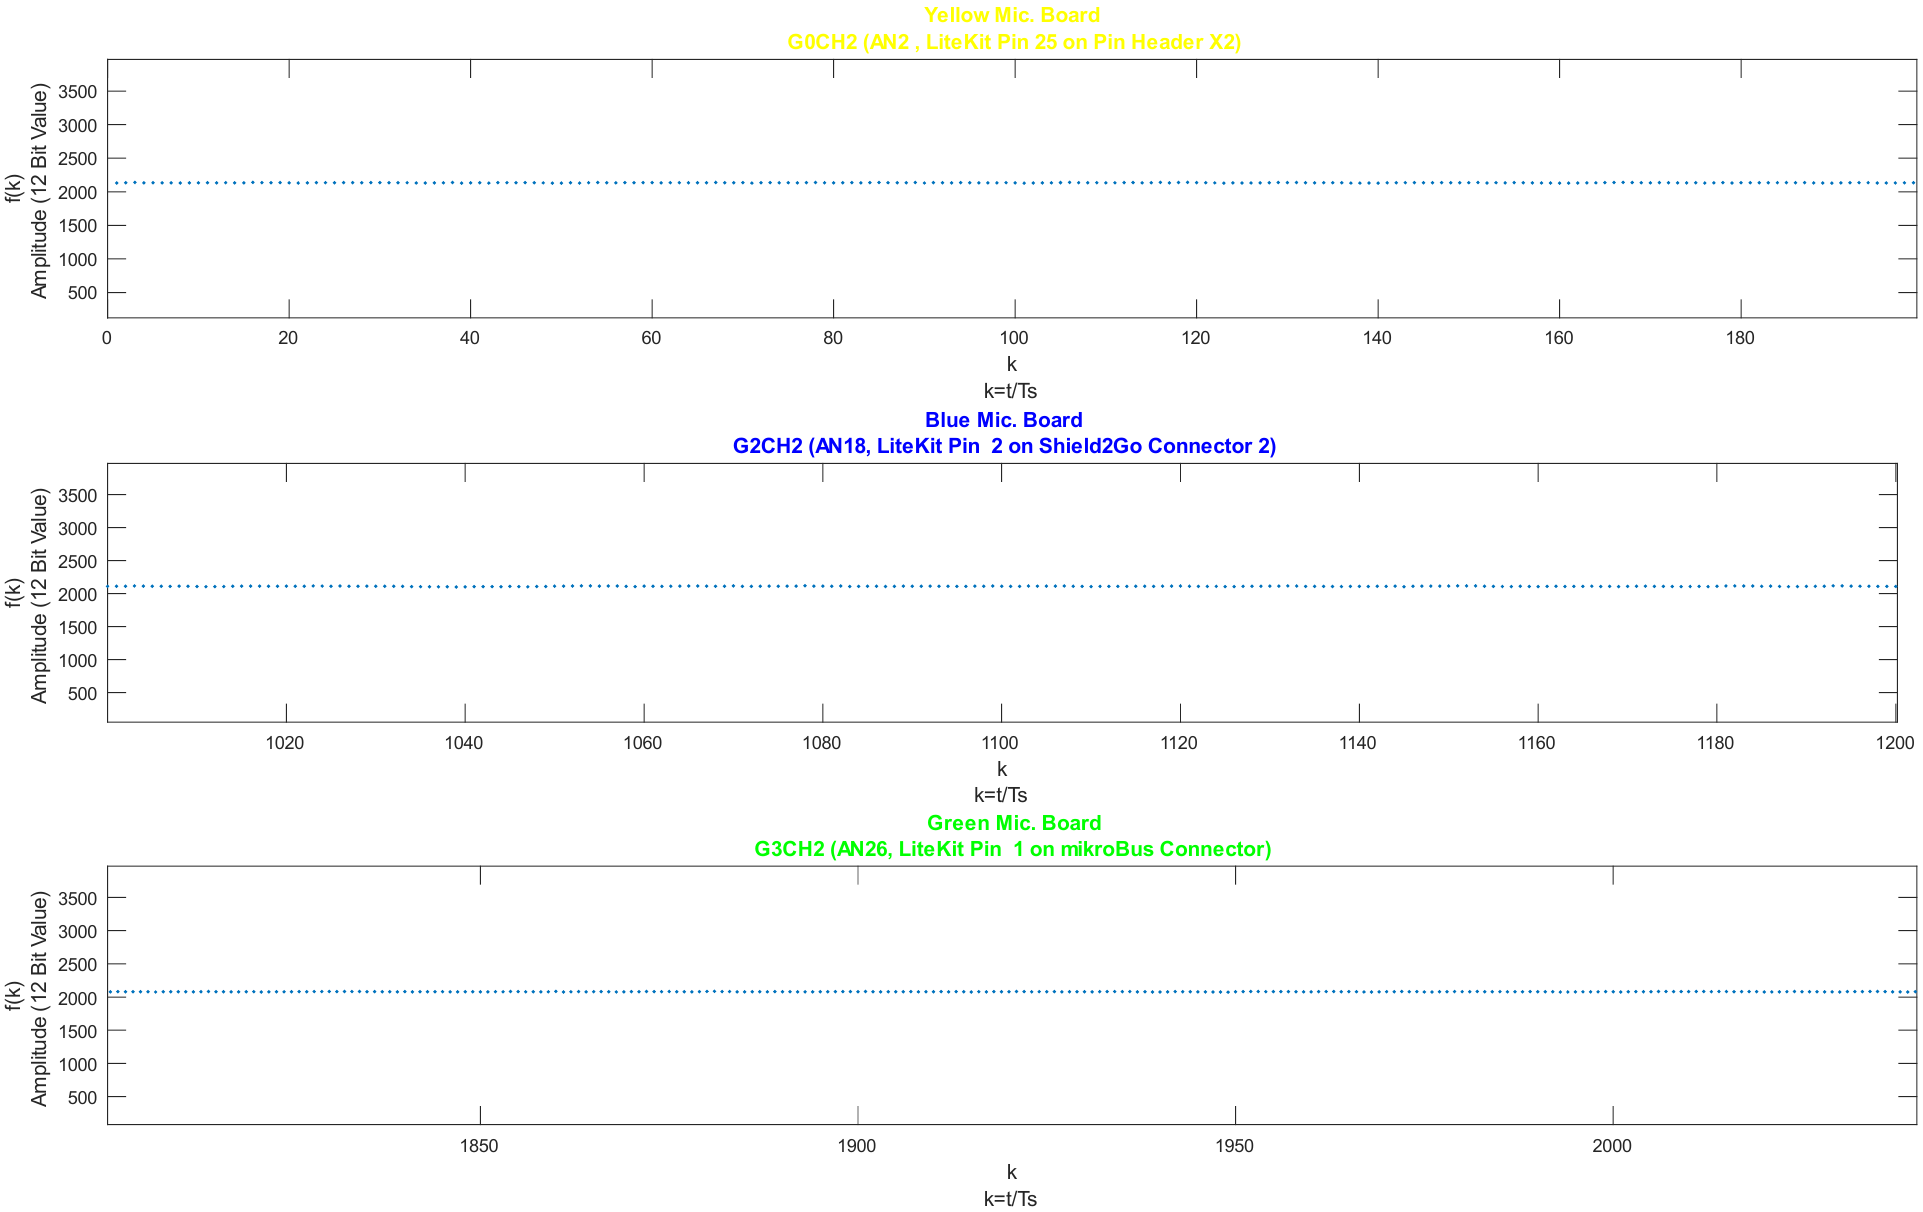
This section delves into the analysis of the noise floor inherent in the microphone modules and the ambient noise levels within the room, observed under quiescent conditions. A key finding from this analysis is the stability and low variance in the signal deflection of all three microphone modules throughout the measurement duration, without significant peaks or unexpected deflections. In alignment with the design and calculations for the Microphone Board's Offset Stage, the Virtual Zero line of the measurements is precisely centered, showcasing an average value of approximately f(k)=2048, or 1.65V. This value, indicative of the double offset voltage, reflects the expected outcome based on the microphone board's specifications and design considerations. The figure below illustrates these findings, presenting the noise floor of the microphone modules alongside the ambient noise measured within the room. Included within this graphical representation are detailed views to emphasize particular aspects of the data. As a vector graph, this illustration can be magnified to various extents without any loss of quality, a feature that applies to all measurement figures included in our documentation. This ensures that the data is presented with clarity and precision, facilitating detailed examination.
Analysis of White Noise and Voice Signal Measurements
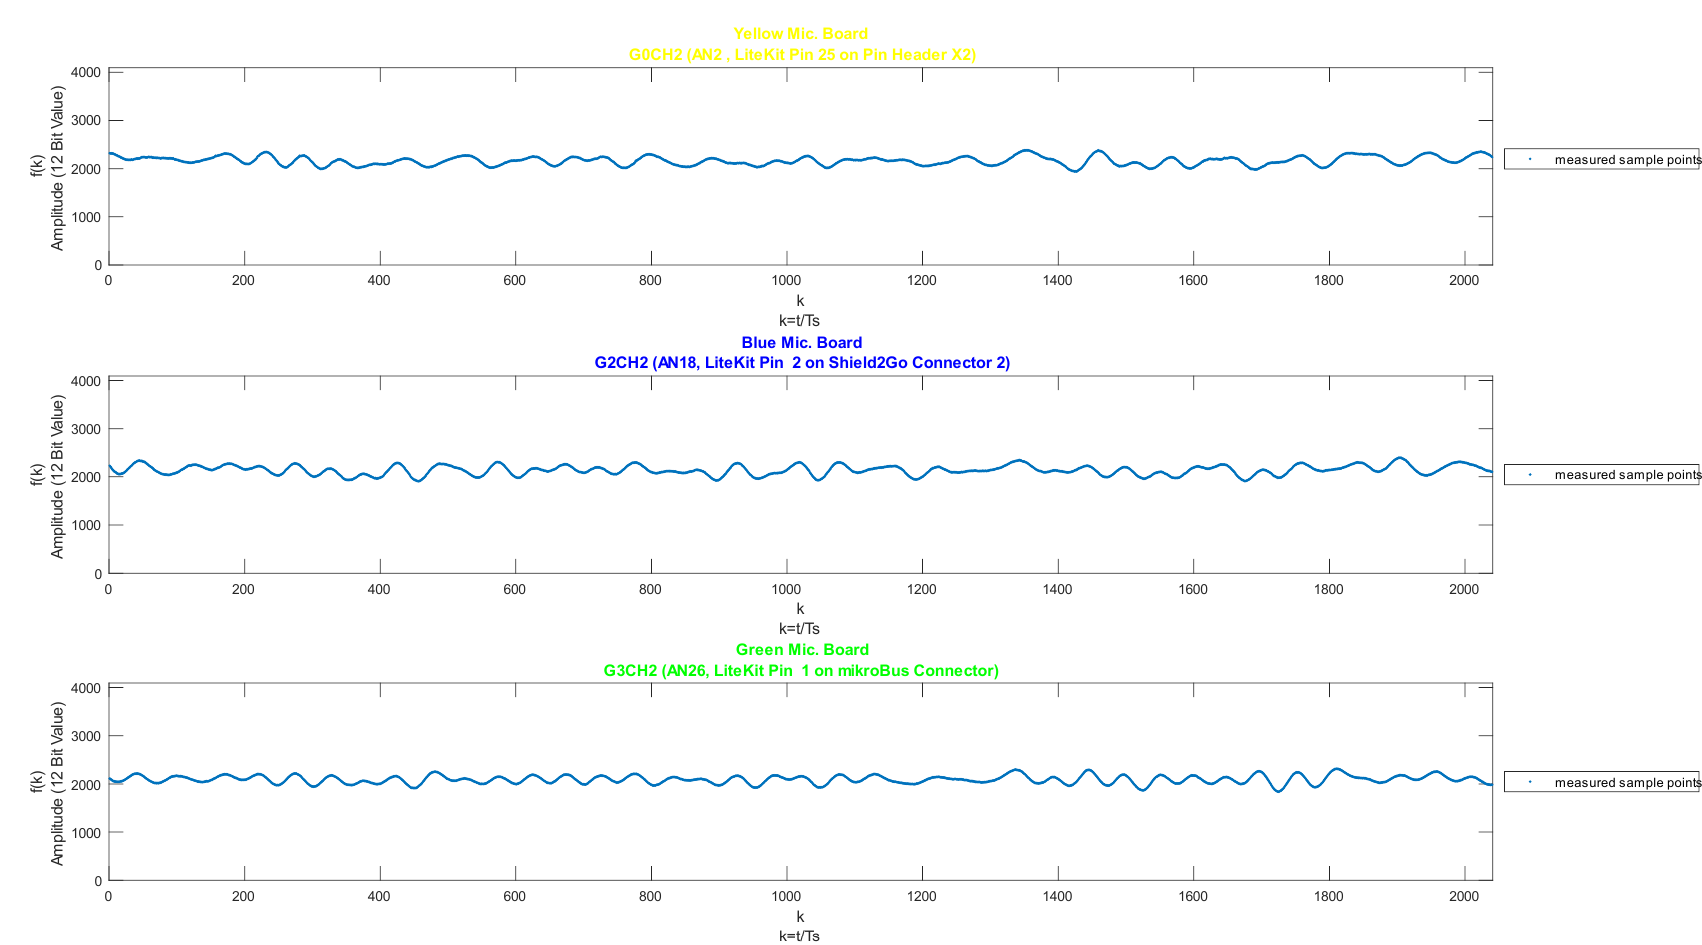
In our exploration of sound signal processing, we conducted measurements using white noise and voice signals played through a stereo Bluetooth speaker. The initial experiment focused on white noise emitted at a distance of approximately 30cm from the target system. The figure below captures the results of this white noise measurement, illustrating the signal's characteristics as detected by our system.
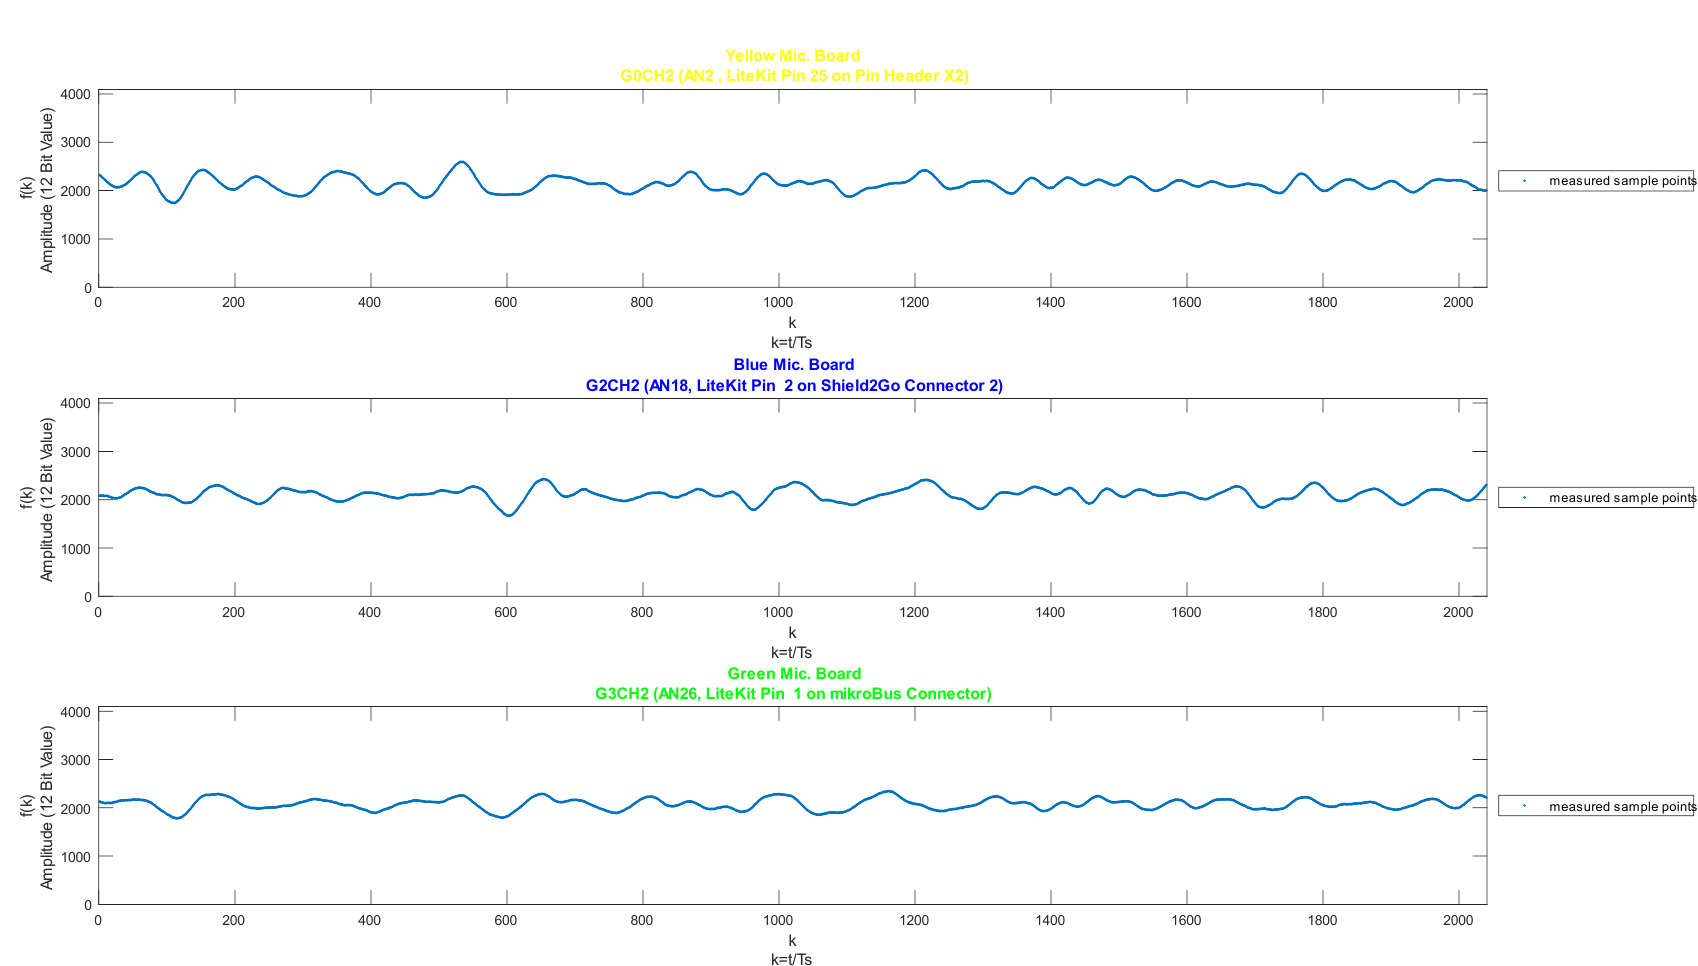
Subsequent measurements were taken of voice signals, specifically of a woman speaking in a reverberant auditorium. These voice signals were recorded at closer proximities, ranging from 10cm to 15cm to the target system. The first of these figures showcases the general voice signal measurement, providing insight into the auditory nuances captured by our setup.
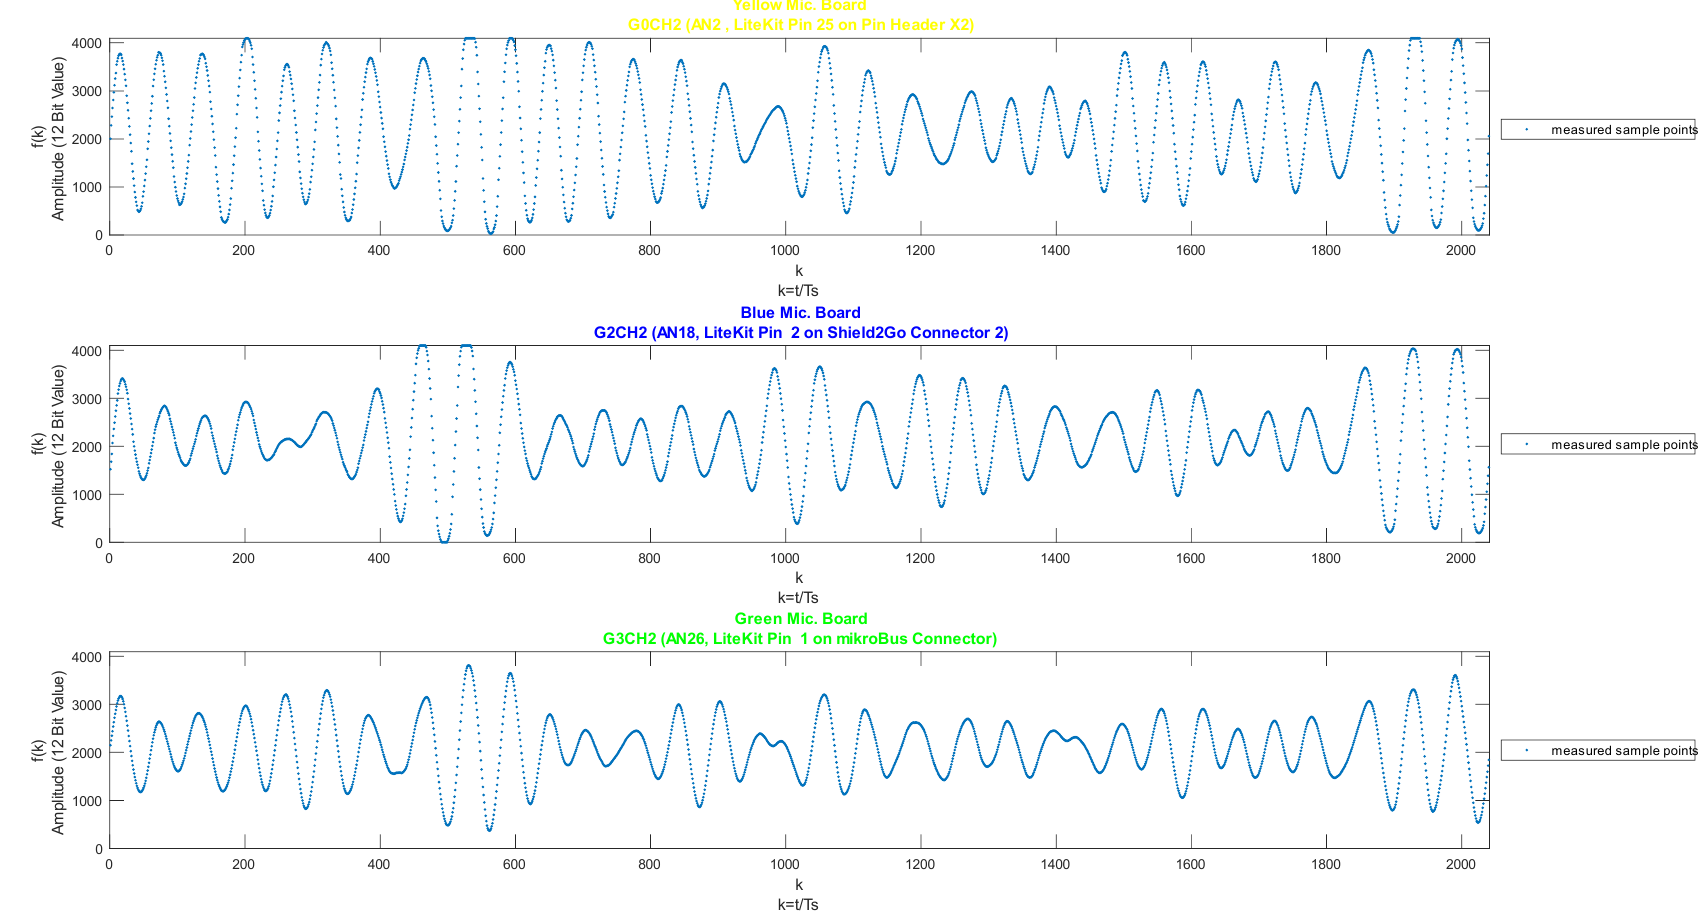
A further detailed examination is presented in the next figure, highlighting a dynamic segment of the speech. During this part, some signal clipping is observed in the outputs of the yellow and blue Microphone Modules. This is contrasted by the green Microphone Module, which, being positioned above the system's defined center, registered a lower mean signal amplitude. This figure offers a closer look at the variations in signal amplitude and the effects of microphone placement on signal capture.
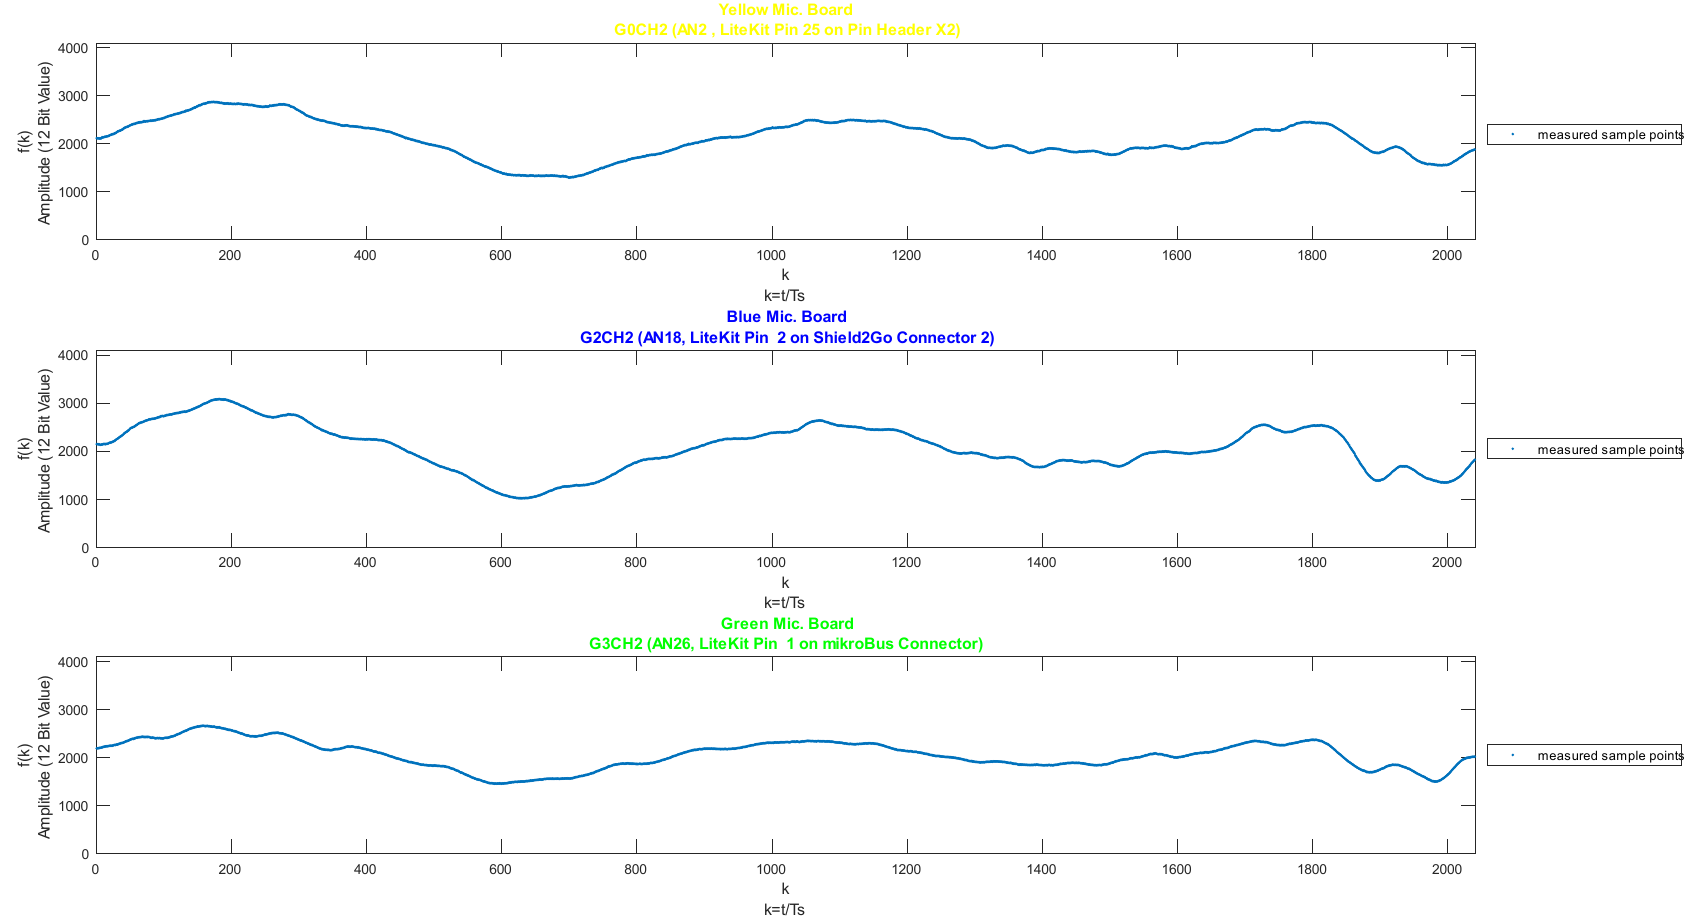
The final figure in this series extends our analysis, presenting additional measurements of the voice signals during the speech. This further demonstrates the system's ability to capture and process complex auditory signals under varied conditions.
These visual representations provide a comprehensive overview of our system's performance in capturing diverse acoustic signals, from the consistent patterns of white noise to the intricate variations of human speech.
Measurement of 40kHz Sine Waves Emitted by an Ultrasonic Transmitter
The series of measurements involved an ultrasonic transmitter used as the sound source, emitting 40kHz sine waves. A stereo Bluetooth speaker stimulated the transmitter with a 40kHz PWM signal, generating a wave between 0V and +5V with a 50% duty cycle. The transmitter, positioned 155cm to 160cm from the target system's center at equal height, ensured that the microphone module signals fell within an optimal range. The figure below displays the measurement results, showing the overall noise floor and detailed signal patterns.
When examining the zoomed-in view, as shown in the subsequent figure, phase differences between the microphone channels become apparent, with the blue microphone module exhibiting slight signal clipping at its upper limit. The observed signal, covering slightly more than 13 cycles, matches the expected outcomes based on the setup parameters.
Additional measurements were conducted by altering the transmitter's orientation relative to the system's center. Turning the transmitter to the left resulted in the highest amplitude being recorded by the left-positioned yellow microphone module, demonstrating the system's directional sensitivity. This effect is illustrated in the figure below, which compares signal behaviors under different spatial arrangements.
In another experimental setup, the transmitter was directed towards the ceiling, testing the system's response to indirect sound wave paths. The figure below shows that, despite this unconventional positioning, a significant signal amplitude was still detectable, underscoring the MEMS microphones' high sensitivity and the room's acoustic impact.
These varied experiments highlight the prototype system's capability to discern and analyze sound waves under diverse conditions, mirroring real-world environments such as hospital rooms. The findings, as depicted in the figures below, offer a comprehensive understanding of the system's operational dynamics and the external factors influencing signal detection and analysis.